People who have read previous versions of this work might be surprised to see that
the contentions herein continue to evolve. Unlike academic works, which are
permanent records of opinions as they were at the time, and to which scholars become
attached for the sake of credibility, this is a dynamic work, continually pursuing a
more accurate description of the topic. Hence this work has changed, as
comments and criticisms from readers like you have created opportunities for
improvements, and it will continue to change. This causes confusion, but
that's better than tenacity in the face of legitimate criticisms. Perhaps this will
always be a work-in-progress, as it is doubtful that any of us will live to see
something as complex as a tornadic supercell completely described. But if we should
ever have to choose between truth and credibility, we must always choose truth,
because credibility isn't worth much without it. And while the work that remains to
be done dwarfs what is already here, it is nevertheless arguable that this has
emerged as the most complete theory of tornadic storms ever presented to the
public. So the open-minded, evolutionary method is working, and therefore, it will
persist.
Also, please note that in meteorology, the term "thermodynamics" is used in the
narrowest of its senses: the dynamics of thermal fluxes. It is also assumed that the
topic is open-air convective systems. Within this context, thermodynamics is the
study of heat sources and sinks that alter the density of the air, which in the
presence of gravity results in airflows, which can be quantified in fluid dynamic
terms. Other disciplines use "thermodynamics" to refer to general principles of
energy and entropy that apply to all forces, including electromagnetism. But in
meteorology, electromagnetism and thermodynamics are studied separately. For
example, the following is a quote from an FAQ page maintained by NSSL.
Question: Are there electromagnetic or magnetohydrodynamic explanations for
the development of tornadoes?
Answer: As far as scientists understand, tornadoes are formed and sustained
by a purely thermodynamic process.
The present work takes a very different position, and demonstrates that
electromagnetism has to be promoted to the status of a peer with thermodynamics if
we are to achieve a more accurate description of the phenomena. But the point here
is that the reader may find it odd to hear electromagnetism and thermodynamics being
discussed as peers — that's not the correct relationship between these two
sets of principles. Yet in meteorology, this is conventional usage of the terms.
Supercell thunderstorms, and the tornadoes they spawn, are considered. Consistency with the current
research trends within the disciplines of meteorology and geophysics is neglected in the pursuit of
a mechanistic model that can more accurately describe the distinctive characteristics of tornadic
supercells. Specifically, the common assumption that electromagnetism is too weak to influence the
behavior of a supercell is challenged. The charge separation process in the storm creates electric
fields that exert a force more powerful than gravity on charged particles, which then exert
aerodynamic forces on the surrounding air, thereby modulating the flow fields. Charged gases also
have lower viscosities, and therefore flow faster in pressure gradients. Furthermore, charged gases
are less prone to turbulence, with dramatic effects on the net velocities. Studying supercells as
charged gases might enable solutions to many otherwise intractable problems. Most significantly, a
mechanistic model of the tornadic flow field is presented. While a tornado occurs within the
influence of a low pressure aloft, and is typically thought to be a simple suction vortex, its
defining characteristics are that the lowest pressure, tightest radius, and fastest wind speeds
occur at the ground, farthest from the low pressure aloft, and where the friction is the greatest.
This proves that the primary energy conversion occurs at the ground, and that the low pressure aloft
is merely absorbing the exhaust from that conversion. In conventional meteorology, the only energy
available for conversion near the ground is latent heat stored in water vapor, but the release of
latent heat continues through the entire height of the tornado (and beyond), and therefore cannot be
concentrated just at the base of the vortex. The only other force present is electromagnetism.
Previous research showed that ohmic heating from the flow of an electric current through the tornado
is more powerful than latent heating, but similarly, this energy is thermalized through the entire
height of the vortex, leaving the extreme low pressure near the ground unexplained. The sustained
current inside the tornado was confirmed by various methods to be greater than 100 amps.
Inexplicably, evidence of such a current going into the ground has never been found. The possibility
not considered by previous research is that the current terminates in the air itself, meaning that
the tornadic inflow is charged. If so, it induces an opposite charge in the ground, and is attracted
to that charge. As the air flows along the ground, skin friction generates heat. Once the air enters
the vortex, the electric current neutralizes the charge, releasing the air from its attraction to
the ground, and thus releasing all of the accumulated thermal potential. This means that the
unexplained power expended by the tornado on the ground answers its own question, as the frictional
heat so generated is the only energy that could cause a robust updraft so close to the ground, while
the charge neutralization is the critical conversion. The energy budget of the entire tornado can
then be reconciled as the sum of frictional heating at the ground, latent and ohmic heating inside
the vortex, and the low pressure aloft. An extensive review of the available data is made, without
finding reason to abandon this model. The implications are then considered.
Figure 1. Conceptual model of the movement of charged particles in a symmetrical tornadic storm (such as a "pulse" storm). Asymmetrical storms, in which wind shear is a big factor, will be treated as variations on the same principles.
Every year in the U.S., on average, tornadoes destroy $982 million worth of property,1,2 and kill 89 people.3 (Note that average damage
estimates vary widely, from one year to the next, and depending on the source of the report.
FEMA reports average losses of roughly $500 million, but that's just what it pays.2 Insurance companies reported losses were roughly $27 billion in 2011 and $15
billion in 2012 — the two costliest years on record.4 The total,
including uninsured losses, is obviously far greater.)
There is no known way to prevent tornadoes, so there is no way to avoid damage to permanent
structures. The only defensive strategy against tornadoes involves teaching people how to
respond in the event of a tornado, and issuing warnings when tornadoes are approaching.
There are three types of tornado forecasts issued by the U.S. National Weather
Service (NWS).
Convective outlooks are issued up to 3 days in advance,
and discuss the probability of tornadoes on a regional basis. These
typically cover substantial portions of states, or several states, and are
not specific enough to warrant defensive measures on the part of the general
public. Outlooks are used to modulate NWS resource allocation, such that
critical conditions are well-monitored.
Tornado watches are issued several hours in advance,
and though more specific than convective outlooks, are still essentially
regional advisories, typically covering over 50,000 km2. While convective outlooks are projections of probabilistic factors,
tornado watches are based on the actual conditions that develop during the
day. The main intent of tornado watches is to give emergency managers time
to prepare for what might happen.
Tornado warnings are issued when Doppler radar detects
mesocyclonic rotation at speeds characteristic of an actively tornadic
supercell. Frequently, storm spotters confirm that the tornado warning was
issued just as the funnel cloud began to descend. In short, a tornado
warning means that a tornado is currently forming, and will be on the ground
in a matter of minutes. These are specific enough to warrant defensive
measures on the part of the general public.
In October of 2007, NWS transitioned from county-wide warnings to "storm-based"
warnings. The warning zones are far smaller, and this has resulted in a vast
reduction in the number of people getting warned unnecessarily.
But despite the advances that have been made, the science behind tornado warnings is
far from mature. The following statistics are from the NOAA 2011
Budget (beginning on pg. xlviii), and show the lead time, accuracy, and false
alarm rate of tornado warnings, 2006~2011.
Table 1. Severe Weather Warnings: Tornadoes (storm-based)
actual
avg
target
2006
2007
2008
2009
2010
2011
Lead Time (minutes)
13
13
14
12
13
12
12
Unwarned Events (%)
25
22
28
34
27
30
30
False Alarm Rate (%)
79
76
75
77
77
72
72
The lead time could be increased, and the number of unwarned events could be
reduced, by lowering the threshold for what is considered to be sufficient
mesocyclonic rotation for tornadogenesis. But this would increase the false alarm
rate, and that would lower the credibility of the information being disseminated.
All factors considered, the existing criteria for issuing tornado warnings are
striking the right balance.5
But with only 13 minutes of lead time, people in harm's way do
not have very many options. Seeking shelter in a better-built structure nearby is
risky, and evacuating is out of the question. (An unfortunate percentage of people
killed by tornadoes die in their cars as they attempt to outrun the storms, not
realizing that poor visibility, downed trees and power lines, and other motorists
can block their way, leaving them totally exposed to the tornado.)
And there is another vital bit of information that is not even present in the
tornado warnings, because we simply do not have this information in advance: an
estimate of how powerful the tornado will become. Most tornadoes are weak, and these
are responsible for a very small percentage of the tornado-related deaths. If the
false alarm rate included all of the warnings for weak tornadoes that posed little
danger to the public, the false alarm rate would be far higher.
Figure 3. Tornado statistics by F-Scale, 1950~1994, from The Tornado Project.
Improvements in the lead time, and in the reliability of the warnings, including
gaining the ability to predict the strength of the tornado that will form, will have
tangible benefits.6 One study cited lost time due to false alarms
as the biggest expense of tornadoes.5 More reliable warnings
would also be taken more seriously, and people would take the appropriate actions,
instead of ignoring the warnings.5 And the greater the lead time,
the more things that can be done to save lives, and even certain types of property.
The following is a rough representation of the kinds of defensive measures can be
taken, given the amount of lead time, and assuming that the warnings are reliable
enough to warrant such measures.
10 minutes — people can go to the lowest level in the building, and
get under something sturdy. This is the extent of the current defensive
strategy.
20 minutes — people could run to nearby structures that offer better
protection, and people in cars could find suitable shelter. Parked cars
could be moved into garages.
30 minutes — airports could get planes into the air to avoid being
destroyed. (See this for photos of Tinker Air Force
Base after getting hit by a tornado on March 20, 1948. A week later another
tornado hit the same base, but meteorologists predicted it, and many planes
were moved into hangers, greatly reducing the destruction.)
1 hour — people in rural areas could get into cars and get out of the
way of the tornado. Schools and businesses could be closed, and sports
arenas could be evacuated.
2 hours — small population centers could be evacuated.
Obviously, the longer the lead time, the less reliable the forecast, and the more
questionable it becomes to consider large-scale defensive measures. But we should not rule
out the possibility that even longer lead times than this might be possible someday.
Furthermore, we should acknowledge that not all decisions are made in exactly the same way,
and require exactly the same degree of certainty. There have been cases in which the
convective outlook was so convincing that schools were closed for the day, and many lives
were saved, even though the conditions had not yet materialized for tornado watches, much
less for tornado warnings.7 Every advance in our understanding of tornadic
storms has led, and will continue to lead, to more lives saved and more property protected.
And while the science of tornadoes is advancing, everybody agrees that it
isn't advancing fast enough. As our cities and suburbs continue to grow, the cost of
storm-scale catastrophes increases.8 Because of this, aggressive
initiatives are being considered for mitigating the risks posed by tornadoes.
Included are plans for the implementation of finer-resolution Doppler radar,9 and/or many more Doppler radar installations,10,11 both of which will improve the quality of tornado warnings. There has even been
funded research concerning the disruption of tornadic storms using microwave energy
beamed down from a satellite,12,13,14,15,16,17 or by
triggering lightning strikes,18,19,20 thereby eliminating the
death and destruction that tornadoes cause.
But these are all brute-force methods, assuming that we already understand the
adversary, and that we simply have to be more aggressive if we are to make progress.
Yet the best-spent money is well-informed money. Seeking a better
understanding of these storms must be part of the initiative, and that is
where we have the greatest opportunity for progress.
Figure 4. Damage from an F4 tornado in La Plata, MD, 2002-04-28, courtesy NOAA.
Figure 5. Damage from an F5 tornado in Bridge Creek, OK, 1999-05-03, courtesy NOVA.
Figure 6. Damage from an EF5 tornado in Greensburg, KS, 2007-05-04, courtesy FEMA.
Figure 7. Damage from EF5 tornado in Moore, OK, 2013-05-21, courtesy AP/Tony Gutierrez.
A study of tornadoes begins with a study of the parent thunderstorms. Current
research focuses on the thermodynamic factors. The most thorough attempts at
modeling the dynamics of thunderstorms have taken the following factors into
account:
differences in air temperature, pressure, and humidity at various altitudes
in the troposphere before the storm begins,
heat sources and sinks, including the Sun heating the surface of the Earth,
as well as heat exchanges due to the evaporation and condensation of water
molecules,
the motion of parcels of air due to changes in density, given the force of
gravity, and given the density of neighboring parcels,
where and when the water molecules will change state within the cloud,
the effect of gravity on liquid and solid water particles, and
the aerodynamic effect that liquid and solid water particles will have on
the parcels of air through which they fall.
That's all of the forces operative at this scale, except electromagnetism.
Unfortunately, physics simulations incorporating just these factors fail to resolve
into supercells. And while probabilistic modeling based on thermodynamics can
predict the emergence of supercells far better than chance, researchers are baffled
by the cases in which all of the known factors were present, and yet no supercell
formed. This suggests that we're missing something, and of course, the only thing
that we're not taking into account is electromagnetism.
The omission of electromagnetism is not because anybody doubts its presence in
thunderstorms. Rather, it is omitted because no one has demonstrated that it is
anything more than a side-effect. The heat generated by lightning is less than 1% of
the total thermal energy in a thunderstorm. This seems to prove that
electrification can be safely neglected in the thermodynamic study of thunderstorms.
But this assumes that the only way that electromagnetism could influence a thermal
system would be with heat, and that might not be correct.
Lightning results from charge separations that build up due to rapid air motion
within the storm. If the electrostatic potential exceeds the resistance of the air,
an arc discharge occurs. But at potentials below the threshold for lightning, the
electric force is still there, and even over a distance of several kilometers, it can exert a force more powerful than gravity on charged
particles.21,22 And the acceleration of charged particles in the
air exerts an aerodynamic force that encourages the rest of the air to travel in the
same direction. In this way, electromagnetism could influence the behavior
of the storm, without generating any heat.
How powerful could this effect be?
While the charge separation process is not fully understood, the part of it that has
been the best studied is the electric charges developed in water molecules. At 100%
relative humidity, water vapor constitutes only 1% of the air by volume. If the
electromagnetic energy in a thunderstorm is only 1% of the total energy, and if that
energy can only act on 1% of the particles in the air, the kinetic energy generated
by electromagnetism is nominally no more than .01% of the total energy in the storm.
And considering the fact that accelerating air by accelerating some of the
particles in it is a very lossy energy conversion, we should be surprised if the
effect of electromagnetism on the rest of the air was as much as .001% of the total
force. In other words, it might as well not be there.
But that analysis is far from correct.
The total amount of EM energy that could be influencing airflows in the storm cannot be
gauged by the energy released by lightning, since it is the energy that does not
get released by lightning that is capable of actually moving air. If the potential exceeds
the resistance of the air, the charge separation is neutralized. At lesser potentials, the
airflows are still being influenced. And while instinctively we might think that lesser
potentials will have even less effect on the storm, the actual amount of electromagnetic
force that does not get discharged in lightning is far larger than the force that does, by
definition. If electromagnetism was like water, the resistance of the air would be like a
dam, and lightning would be the amount of water that leaked through the dam. If we want to
know the total force on the dam (i.e., the aerodynamic force on the surrounding air), the
amount of water that got through the dam (i.e., the lightning) is irrelevant, or even
inversely related. Either way, it is far less than the total.
Furthermore, water molecules are not the only molecules capable of becoming charged
in the atmosphere — they are just the ones that have been studied the most.
Nitrogen (N2) and oxygen (O2, O3) are as easily
ionized as water molecules, at roughly 14 eV.23,24 In the gaseous
state, nitrogen and oxygen do not typically host net negative charges, but all
matter can become positively charged. So in the positive charge regions of the
storm, we can expect net charges to spread freely into the surrounding nitrogen and
oxygen during particle collisions. This will distribute the net charges throughout a
far larger number of far smaller particles, greatly increasing the aerodynamic force
in the process.
Perhaps more significantly, charged air has a lower viscosity, meaning that it flows
faster in response to a pressure gradient.25,26,27 This is
especially true when the reduction in viscosity delays the transition to turbulence,
which is a threshold regularly crossed inside thunderstorms. So again, EM forces
can influence a thermodynamic system, without generating any heat.
And the EM forces need not be powerful, even by thermodynamic standards. Only 1 out
of every 1,000 thunderstorms becomes a supercell. So we know before we begin that
we're looking for something that normally is too weak to be a factor. In the rare
exception that a supercell forms, distinctive EM phenomena are observed.28,29,30,31,32 It's possible that in a supercell, weak EM forces resolve
into a large structure, and the sum of the effects of the weak forces produces a new
property set, while in the other 999 out of 1,000 cases, the weak forces never get
organized into anything new.
Yet how are we to approach the study of such rare cases?
The difficulty of this endeavor becomes more obvious when we consider that electromagnetism
is 39 orders of magnitude more powerful than gravity. Normally, if EM forces are present at
all, they completely dominate. Yet the contention here is that the EM forces are too weak to
dominate, and that they are merely modulating the effects of gravity. For electromagnetism
and gravity to be peers, only 1/1039 of the possible EM force can be present.
Measuring and/or estimating the effects of near-infinitesimal forces is tricky. The problem
is exasperated by indirect and/or incomplete data, since the main bodies of the storms are
(obviously) beyond the reach of ground-based instrumentation, and due to the transient and
hostile nature of such storms.
Because of the difficulties, many researchers have concluded that a mechanistic
model is beyond the capabilities of existing science. Thermodynamic simulations fail
to resolve into supercells, and the only other force present is electromagnetism,
but modeling the subtle effects of near infinitesimal forces in such a complex
system would take fine-grain data that we don't have, and processing the data would
take a supercomputer that we can't afford. This leads to the conclusion that with
current technology, the best that we can do is phenomenology. With the data that
are available, we can search for statistical relationships between
preconditions and outcomes that might yield predictive value, and this we can do
without having to identify the physical forces at work.
Unfortunately, the phenomenological method is past the point of diminishing returns. Recent
research demonstrated that even with fine-grain in situ data (such as numerous
anemometers under the storms and dual Doppler radar data within 15 km),
and given plenty of time to post-process the data, supercells that produce tornadoes are
difficult to distinguish from those that do not.33 This means that
operationally, with far fewer data, and no time for post-processing, we have no reason to
expect improvements in tornado warning statistics. And that means that it's time to
try something new. So is there another approach?
Since the existing meteorological data (from radar, anemometers, etc.) are not revealing
the active ingredient in tornadogenesis, it goes without saying that we need to look at
other types of data. And there is only one "other type" possible: electromagnetism.
The implication of that is that we need a new framework, since there isn't any place
to put EM data within the existing thermodynamics-based theories. So we need to
start over. This sounds like a Herculean task, but there is a way of approaching it
that greatly increases the chance of success.
Interestingly, tornadic supercells have a large number of very distinctive
characteristics. All the more interesting is that the solution domain is extremely
small. The two facts together suggest that the problem can be solved with the
process of elimination. Each extremely distinctive characteristic can only be the
manifestation of a finite number of physical forces, and the more distinctive the
phenomenon, the fewer the possibilities. With two characteristics in consideration,
the solution domain is even smaller. If the solution domain was already small, and
if enough characteristics are taken into account, it might be possible to
demonstrate that there is really only one solution. If so, such will constitute
definitive proof of the hypothesis.
Just such a method has been employed, and the results are presented here. The data
are still incomplete, and there will always be many ways of interpreting
incomplete data. Hence each point might only establish a possibility. But if a
singular hypothesis can explain a comprehensive range of distinctive phenomena, the
chance of it being fundamentally incorrect is small.
And while it is certainly true that an hypothesis with a comprehensive scope might
be a false economy if accuracy was sacrificed in the process, the present work is
more consistent with the laboratory and field data than the constructs
currently in use, meaning that the value is real.
But it should be noted that realizing this value requires employing an unconventional
method. The standard scientific process dismisses all of the unusual, extreme-range data,
and focuses on the bell curve in the middle, where the dominant forces typically reveal
their true natures. Such is well-understood by all. Yet if the analysis of the bell curve
fails to yield the causal mechanism(s), it becomes necessary to re-admit all of the
anomalies as legitimate data, and to start over from the beginning. Hence the bulk of this
work focuses on extreme conditions that are not mentioned in the current literature, or if
they are, the anomalous aspects of the phenomena are not identified as such. Such a study is
difficult, and care must be taken to ensure that the data are actually real, and are still
squarely within the problem domain (even if they are outside of the accepted paradigm). So
the general form of this work is to describe a well-known phenomenon along with its
conventional treatment, and then to identify the aspects that lie fully outside of the
current model(s), revealing the need for a new framework. The primary criticism of this work
is that it answers questions that are not currently being asked, which is true, but
irrelevant. The data are legitimate, as is the need for a more comprehensive, more accurate
model, and this is how progress is made when the existing paradigm can no longer be
improved. In other words, this work seeks to answer all of the questions that are currently
being ignored, since surely that is where we will find the solutions to these
riddles.
Since the original source of all of the energy in a thunderstorm is heat, we should
start with a quick review of the thermodynamic factors.
Thunderstorms are powered by heat stored in warm, moist air in the lower
troposphere. If the upper troposphere is far cooler, there is "convective potential"
(i.e., the warm air wants to rise and the cool air wants to fall, so there is the
potential for convective motion).
Usually this convective potential dissipates as fast as it is created, as small
thermal updrafts generated by high surface temperatures rise gracefully, displacing
cooler air that then falls. Cumulus humilis clouds might form, but these are not
thunderstorms.
If "convective inhibition" is present, an unusually large amount of heat and
humidity can build up in the lower troposphere. This requires the presence of a
layer of hot, dry air above the warm, moist air at the surface, such that the warm
air will not have the buoyancy necessary to rise into the upper troposphere. As the
Sun continues to heat the surface of the Earth, air temperatures near the surface
increase, above those necessary for thermal updrafts had the hot air not been there.
Now the convective potential can build to extreme limits.
So there can be three different layers of air, from top to bottom:
cool, dry air in the upper troposphere,
hot, dry air in the middle, and
warm, moist air in the lower troposphere.
These layers will be stable in this arrangement, assuming that the cooler air on top
is far lower in pressure, and therefore is light enough to exist happily above
hotter air, and so long as the middle layer keeps the other two layers from coming
into contact with each other.
But if the warm, moist air at the bottom gets hot enough to break through the hot,
dry air above it, and come into contact with the cool, dry air in the upper
troposphere, the results can be explosive. The reason is not so much because of
differences in temperature, but because of differences in humidity. When warm, moist
air meets cool air, the warm air gets cooled, and its water vapor condenses into
precipitation. For the water molecules to change state from gas to liquid (or to
solid higher in the cloud), they have to get colder, so they shed their heat into
the surrounding air. This is called the release of "latent heat," and so much heat
is released by this process that now the updraft will be hot enough to rise all of
the way to the top of the upper troposphere, 12 km above the
ground.21
The next thing that happens is that a single updraft creates an entire storm. The
rising of the initial updraft creates a low pressure underneath it. This reduction
in pressure encourages the condensation of water vapor, which releases latent heat,
making that air positively buoyant as well. When it rises, it pulls in more air
behind it, which does the same thing. In this way, the initial updraft triggers a
chain reaction that produces a continuous flow of air from the lower troposphere
into the upper troposphere. The result is a cumulonimbus cloud, and this can become
a thunderstorm.
Figure 10. Cumulonimbus cloud, courtesy Grant Firl.
Within the first 1⁄2 hour, a force emerges that might suppress the
updraft. As the updraft continues to rise through the storm, air in the middle of the cloud
can get "entrained" into the updraft. The reasons for this are poorly understood, and this
topic will be treated more thoroughly in a subsequent section. But for now it will suffice
to just employ the common notion that the updraft generates a Venturi effect that pulls in
air laterally, adding it to the updraft. This typically happens most where there are bursts
in the speed of the updraft, because water molecules are changing state, and latent heat is
being released. When it happens at the bottom of the cloud, where water molecules go from
gas to liquid, the entrainment simply pulls in more warm air from the lower troposphere,
reinforcing the updraft. But this also happens in the middle of the cloud, roughly 4 km above the surface, where water molecules are going from liquid to
solid.
The initial impact of mid-level entrainment is to weaken the updraft. The air that
is drawn into the updraft is cooler, and it reduces the buoyancy. A weak updraft
might not survive this process, but a powerful updraft will keep going. If it does,
then eventually, the air motion in the upper portion of the cloud resolves into a
toroidal flow, with the updraft in the center, and the downdrafts around the
outside.
It's significant to note that in fluid dynamics, a toroidal airflow is a very
energy-conservative form. Consider, for example, how far a smoke ring can travel,
given just a little bit of momentum to start.34 It has no internal
strength, and therefore can be easily perturbed. But it is a low-friction,
self-stabilizing structure that spins freely in the surrounding air. So if the
conditions are right, this form will emerge. In the top half of a thunderstorm,
there are upward, outward, downward, and inward forces to establish and maintain the
toroidal form, so we can expect this to be present.
It should also be noted that once this form emerges, the air being entrained back
into the updraft is no longer cold air, but rather, recirculating warm air. The
coldest air in the downdrafts around the outside of the cloud will continue its
descent. The air most likely to be drawn back into the updraft will be warmer air
that isn't falling as fast. This air will insulate the updraft from cold
air entrainment. Hence the toroidal form eventually emerges as a frictionless
recirculation of warm air, motivated by the updraft in the center and by the
downdrafts around the outside, and that sheds the coldest air away from the
updraft.
Figure 11. Air in the middle of the cloud is entrained back into the updraft, setting up a toroidal airflow in the upper portion of the cloud.
After about an hour, powerful and sustained downdrafts will make their way to the
surface level, where typically they will put an end to the updraft. At the top of
the cloud, precipitation released from the updraft evaporates in the drier air of
the upper troposphere. The evaporation process cools the air, increasing its
density, and this makes it fall. So downdrafts are created, equal in power to the
updraft that initiated them. These downdrafts will head straight for the low
pressure under the updraft, filling it with cool air. This cuts off the supply of
warm, moist air to the updraft. When this happens, that updraft is finished.
Past this point, thunderstorm activity might begin in adjacent parcels of air. The
downdrafts displace warm air at the surface, possibly with enough force to elevate
it out of the way. If so, this might trigger a new round of precipitation, and new
updrafts will form next to the old one. These new updrafts will follow the same
course, and in this way, a lateral chain reaction can develop across the
countryside, with updrafts causing downdrafts that then cause new updrafts
elsewhere. This can result in a cluster of thunderstorms covering
thousands of square kilometers.
Figure 12. Downdrafts undercut the old updraft, and then create new updrafts elsewhere.
The existing thermodynamic model, as described in the previous section, is
relatively complete as concerns "normal" thunderstorms. But it falls well short of
explaining supercells. A supercell is a single-updraft storm that keeps going for
several or many hours, somehow outliving its own downdrafts. Explaining how a single
cell can persist for so long, with thermodynamics alone, has proved challenging.
There has to be some sort of force that transforms a random set of low-power
updrafts into one organized, high-power mesocyclone. But the physics for this
organizing force has not been demonstrated.
In the absence of an understanding of what actually causes supercells and tornadoes,
a numeric model has been developed, as depicted in Figures
13~15.35,36,37,38,39,40,41,42,43,44 (More sophisticated modeling than this is being
done,45,46,47,48,49,50,51,52,53 but the comments below
apply equally to both strategies.)
Figure 13. Differences in wind speed and direction result in horizontal rotation in the air.
Figure 14. Horizontal rotation is tilted vertically by an updraft.
Figure 15. The vertical rotation grows into a mesocyclone.
While this model has a certain intuitive appeal, it is not physics. Figure
13 represents a plausible initial condition, as crosswise
vortexes in boundary layers are common. But the rest of the model abandons physics
in favor of simple constructs that are purely numeric. Such "math" can cause
supercells on computer screens, but cannot cause supercells in the atmosphere.
First, Figure 14 describes an updraft powerful enough to rise rapidly
into the upper troposphere. But this is not just a simple thermal updraft rising because of
high surface temperatures. The only way to get an updraft of the implied speed and force is
for warm, moist air to come into contact with cool air, and for there to be the release of
latent heat. In other words, a powerful updraft is the result of the convective potential
between the upper and lower tropospheres. If a parcel of air crosses the boundary,
the potential is released, and the updraft shoots skyward. So it is one of the givens of the
construct that because of the robustness of the updraft, it has already crossed the boundary
from the lower and into the upper troposphere. And yet another one of the givens is that the
boundary between these two layers of air remains distinct, as the crosswise vortex in the
boundary persists. These two givens are mutually exclusive. Either the boundary has been
crossed, and latent heat is being released, therefore there will be a powerful updraft, or
the cap layer is still effective in maintaining the separation between the upper and lower
tropospheres, in which case there will be no updraft. There cannot be a powerful updraft
and an unbreached boundary separating the upper and lower tropospheres.
Second, even if some truly enormous source of heat at the surface (such as the
eruption of a volcano) had generated an updraft capable of rising into the upper
troposphere without the release of latent heat, this updraft would not preserve a
boundary condition such as a crosswise vortex. When an updraft rises, it does not
elevate the air above it, but rather, it burrows its way through that air. The
outside of the updraft is slowed by friction with the surrounding air, while the
inside is less impeded. This sets up a hemi-toroidal motion at the top of the
updraft. The outward splaying at the top of the updraft splits the air into which it
is rising. This includes breaching any boundary condition that it encounters, such
as a crosswise vortex.
Figure 16. An updraft burrows through the cap layer, and into the upper troposphere. It does not push the cap layer upward.
The only way to get a boundary condition to move as it does in the standard model is
to have high pressure below the boundary, and low pressure above it, such that the
boundary is simply shifted, without local perturbations. But the forces necessary to
do this are simply not present. The energy in a thunderstorm comes from the
convective potential across the boundary. This fact cannot be overlooked.
Third, Figure 15 represents the eventual outcome of whatever
process(es) created the mesocyclone, but leaves it up to the imagination as to how
the boundary vortex morphed into a cyclonic vortex. A boundary vortex requires a
constant input of energy from the outside in order to keep it organized. If it no
longer has two different bodies of air moving in two different directions on each
side of it, it will cease to exist. So even if we could supply enough high pressure
below it, and low pressure above it, to tilt it into the vertical position, we would
still need to keep a steady stream of air on both sides, going in different
directions, to keep this vortex rotating. And this kind of bi-directional motion is
simply not present in the upper troposphere. At best, one might say that a powerful
updraft rising into a shearing upper troposphere might develop eddies on
its leeward side, and these would be vertical-axis, "streamwise" vortexes.36 But streamwise vortexes are no different from crosswise vortexes in
that both of them require constant inputs of centripetal force from the outside to
stay organized, and this force is supplied by differences in wind vectors outside
the vortexes. So there's no way that a streamwise vortex on the leeward side of an
updraft will continue to rotate after the updraft has dissipated. And as long as the
updraft persists, it is by definition the dominant force. So it will
entrain air into itself, robbing air that might have risen into a streamwise vortex
on the leeward side. Hence there is no way for a secondary vortex outside of the
updraft to become host to a new updraft inside the vortex, initiating the
transition to a cyclonic vortex.
All of this leads to the conclusion that there is simply nothing that is physically
possible about the standard model of supercells.
So just what kind of theory is this, that clearly violates very basic principles of
thermodynamics? The answer is that this is a mathematical model, not a physics
model, and there's a big difference. There is a lot of mathematics in physics, but
there doesn't have to be a lot of physics in mathematics. It's always possible, and
frequently quite useful, to develop mathematical algorithms that mimic the gross
characteristics of a phenomenon, even in the absence of an understanding of the
physics that is driving those characteristics. For example, if we are doing a
coarse-grain study that doesn't need fine-grain specificity below a certain level,
we use pure math to instantiate the low-level behaviors that do not concern us. This
leaves more processor power available to calculate the higher-level behaviors that
do concern us.
For this very reason, meteorologists have developed a mathematical, non-physical model that
mimics the gross characteristics of supercells. The granularity of interest is at the level
of the cold, warm, and occluded fronts (which are far larger than the storms themselves)
that create the potential energy. The actual form that the energy release takes within the
storm is considered to be an effect rather than a cause. As such, there is no need to model
the storm-scale behaviors with mechanistic physics, and simple mathematical algorithms are
the more economical alternative. Due to the statistical relationship between wind shear and
supercells, the standard model starts there. How does wind shear produce a mesocyclone?
Crosswise vortexes in boundary layers are common, and fluid dynamic software to model such
vortexes had already been developed. Once instantiated, the crosswise vortex can then be
programmatically modulated into any other form, such as a mesocyclone. In other words,
software can do things that physics cannot.
So what's the point in writing software that behaves in ways that cannot possibly
happen in nature?
The objective in such "modeling" is simply to create a calculation engine that can
associate preconditions and outcomes. In other words, once the software can take a
crosswise vortex in a shearing boundary layer and turn it into a mesocyclone (which
physics cannot, but that doesn't matter), the software can then be tweaked to
produce the right mesocyclone from the given shearing conditions. So if we know that
it takes a certain amount of shear (not too much and not too little) to produce the
most robust mesocyclones, we can modify the software to favor those conditions when
deciding how much mesocyclonic enhancement to apply to the output. With successive
trials we can fine-tune the algorithm until the output matches the field data.
There are actually a number of thermodynamic factors that are statistically related to the
chance of a mesocyclone becoming organized. Wind shear (including the elevation of the
boundary, the difference in the directions of the winds, and the difference in speeds),
temperature, and humidity are all acknowledged in the thermodynamic calculation engine, and
these are routed into the custom mesocyclone generator. The result is a predictive tool that
performs well above chance.
But there are two very fundamental problems with this model.
First, thunderstorm prediction using thermodynamics is fairly reliable, but mesocyclone
prediction is not. The rare 1 in 1000 case should be easy to predict, because it
should take rare conditions to produce. But it's becoming clear that whatever those
conditions might be, they are not registering in the data that we're currently collecting.
This shouldn't be a surprise, since all attempts at modeling mesocyclones just with
thermodynamics have failed. A common opinion among researchers is that they failed because
they still haven't found the exact fine-grain conditions that must be present for the fluxes
to fall into the mesocyclonic pattern, but this is naïve. Even if we set up a mature
mesocyclone in a Navier-Stokes engine and let it run, the mesocyclone falls apart. There is
some sort of organizing principle in a mesocyclone that we just don't understand. This will
be covered in more detail later, but at this stage in the analysis, the significance is that
this proves that non-thermodynamic (i.e., electromagnetic) factors have to be present, and
purely thermodynamic modeling (statistical or mechanistic) will never predict mesocyclones
with a high degree of accuracy.
Figure 17. Factors used in the operational prediction of severe weather, courtesy NOAA.
Second, only 1⁄4 of all mesocyclones produce tornadoes,54 and recent research demonstrated that even with fine-grain in situ data, supercells
that produce tornadoes are difficult to distinguish from those that do not.33 So even if we could predict mesocyclones accurately just with thermodynamics, we're still
stuck with a 77% false alarm rate from all of the mesocyclones
that didn't produce tornadoes, and lost time due to false alarms has been cited as the
source of the largest economic impact of tornadoes.5 Furthermore, the
existing model provides no way of predicting the strength of the tornado that will form. Of
the 23% that are not false alarms, only 26% of the cases
(or 6% of all warnings) become EF2+ tornadoes, which are responsible for 96% of the
tornado-related fatalities. If we considered it to be a false alarm if there was no EF2+
tornado, the false alarm rate would be 94%. At that rate, the general public doesn't take
the warnings very seriously, meaning that the entire enterprise has yet to deliver on its
promise.
Sooner or later, all will agree that the thermodynamic regime has passed the point
of diminishing returns, and that the only way to improve the accuracy and lead time
of tornado warnings is to build a new model that takes electromagnetism into
account. The present work anticipates that conclusion, and describes just such a
model.
In any thunderstorm, there is a charge separation between larger precipitation,
which is negatively charged, and smaller bits of precipitation, which are positively
charged.55,56,57 Over time, a net negative charge accumulates in
the middle of the cloud, as the heavier precipitation descends toward the ground,
while a net positive charge accumulates at the top of the cloud, where small,
positively charged ice crystals linger, too light to fall at a measurable
rate.58,59 The electrostatic potential between the ground and the
negative charge in the middle of the cloud is typically in the tens of millions of
volts. The potential between the ground and the positive charge at the top of the
cloud can exceed a hundred million volts.60
In a supercell, there is an unusual lack of precipitation falling out of the cloud
as the storm develops,39 and there is an unusual build-up of
negative charge in the middle of the cloud. It's possible that the
negatively charged precipitation is being held in suspension by an unusually strong
positive charge at the top of the cloud.22 The source of the
positive charge would be earlier thunderstorm activity.61,62 This
powerful positive charge could simply be the result of one storm lasting an
unusually long period of time, and its own positive charge simply continuing to
accumulate. It could also be the result of the positively charged anvil of one
thunderstorm overhanging another thunderstorm.63
Figure 18. Main charge regions develop in the cloud.
Once the main negative charge region develops in the middle of the cloud, there is
good reason to believe that mid-level entrainment will pull the negatively charged
precipitation back into the updraft.64,65
All other factors being the same, the updraft does not have a net charge. It starts
out being neutrally charged. When precipitation first forms inside the updraft, it
is neutrally charged as well. Interactions among the ice crystals that form at
higher altitudes result in a negative charge being transferred to whichever particle
is heavier. But at that point, no charge separation has occurred, and the updraft
still has no net charge.
But once gravity separates out the heavier precipitation into the main negative
charge region, and entrainment pulls these negatively charged particles back into
the updraft, the updraft will then be bearing a net negative charge. When the
negatively charged precipitation recirculates through the downdrafts and back into
the updraft, the downdrafts become charged as well.
If we combine what we know about the fluid dynamics of a developing thunderstorm
with what we now know about the main charge regions, a new picture emerges. But to
bring it into focus, we first need to clarify the fluid dynamic component.
It was stated previously (in the section entitled "Thermodynamics") that the updraft generates a Venturi effect,
resulting in mid-level entrainment. The entrainment itself then joins the existing
upward, outward, and downward motions, resulting in a continuous loop of
recirculating air. We know that this happens. And the conventional explanation
certainly credits the Venturi effect for causing the entrainment.
But this isn't accurate enough for inclusion in a mechanistic construct. Crossing
the freezing line does release latent heat, as the water molecules go from
liquid to solid, but to think that there will be a "burst" in speed sufficient to
create a Venturi effect is just not correct. When water molecules go from gas to
liquid at the bottom of the storm, they release 7.5 times more heat than when they
go from liquid to solid in the middle of the storm. So we should actually expect the
mid-level state change to merely relieve some of the back-pressure on the expansion
from the low-level state change.
To visualize this, imagine a burner with an exhaust plume that rises into the open
air, and suppose that some distance above the burner, we mount a catalytic converter that causes
secondary combustion of the remaining fuel. Suppose that the secondary combustion
releases 1⁄7.5 the heat as the primary combustion at the bottom.
We would hardly expect the secondary combustion to create a burst in speed
sufficient to entrain fresh air from the sides of the plume. Rather, the plume that
was accelerated from the primary heat source fights friction as it rises, so it is
slightly higher in pressure than the ambient air. A (miniature) burst in speed above
it will relieve that pressure. It will not leave that high pressure to fend for
itself, and generate the low pressure necessary to pull air laterally into the flow.
This means that the conventional "explanation" for mid-level entrainment is just an
observational rationalization, and properly put, it is anomalous. As fluid dynamics
can't explain it, we'll look to EM principles to resolve the issue mechanistically.
We must also clarify our concept of the general context in which mesocyclones form.
The standard models have rotation beginning as a stretched crosswise vortex in the
cap layer, or in a streamwise vortex on the leeward side of the updraft. Either way,
the rotation is said to originate at the base of the updraft. Yet the evidence
indicates that rotation begins in the top half of the storm, and then migrates
and/or extends downward from there.40,66,67,68,69 In fact,
developing mesocyclones frequently display a well-formed hook echo 5 km above the ground, when there is little to no rotation at the base of the
updraft. So we should focus our efforts on understanding the development of
mesocyclones in the top half of the storm, where a robust toroidal recirculation has
(inexplicably) emerged, in the presence of the main positive and negative charge
regions.
Figure 19 shows how a well-organized recirculation could
develop in the given conditions.
A new updraft intrudes on an existing main negative charge region.
The updraft elevates the air into which it rises. Note that the main
negative charge region has electrostatic pressure. So the charges flow
vigorously toward the void left by the elevated charges.
The updraft breaks all of the way through the layer. At this point we'd
normally expect the elevated air to settle back down to its original
altitude, instantiating boundary vortexes between itself and the updraft.
But this air has electrostatic pressure, so it will more likely splay
outward.
The splaying continues, and electrostatic pressure pushes new air to replace
the elevated air.
Outwardly-flowing air begins to fall as it seeks its equilibrium altitude.
When it encounters the downdraft at the outside, it falls rapidly.
The upward, outward, and downward aerodynamic forces, and the electrostatic
pressure, resolve into a continuous toroidal flow.
Figure 19. Main negative charge region morphs into a toroidal boundary vortex.
Once this form emerges, it becomes the solitary boundary layer vortex between the
updraft and the surrounding air in the top half of the storm. At the same time, it
eases friction below the expanding anvil, and helps shed downdrafts to the outside,
away from the updraft. Electrostatic pressure then closes the loop into a
continuous, frictionless structure.
As mentioned previously, toroidal flows are energy-conservative, and are easy to
establish and maintain. This particular toroid should be especially robust, as it
has energy sources on three sides. Furthermore, the electric charges will help
organize the form. Charged air is capable of greater laminar speeds, because electrostatic
repulsion discourages the low and high pressures inherent in turbulent flows.25,26,27 Hence electrostatics endows the toroid with a degree of
rigidity that we would not otherwise expect, and this enables a faster, laminar
flow, without boundary vortexes between it and the updraft, anvil, or downdrafts.
Essentially, it becomes a rigid but free-wheeling structure that organizes the
surrounding flows, and itself achieves the same speed as the updraft, anvil
expansion, and downdrafts. In this context, robust mid-level "entrainment" goes from
inexplicable to inevitable.
Figure 20. Toroidal airflow becomes organized.
We should also note that the toroidal recirculation of negatively charged rain and
hail will gain a lot more rigidity as a positive double-layer develops.
Positive double-layers (also known as "shielding" or "screening" layers) are a
well-known phenomenon, where negative charges suspended in the middle of the storm
attract positive ions, forming distinct layers of opposite charge. The source of the
positive charge is virga falling out of the positively charged anvil. When this
evaporates, it creates downdrafts, which are then attracted to the main negative
charge region by the electric force.
Ordinarily, strong electric fields between oppositely charged layers don't last long
in a fluid medium. The electric force is so powerful that it takes a rare set of
circumstances for electrostatic potentials to develop without getting neutralized as
fast as they are created. But in thunderstorms, and especially in supercells, such
circumstances exist. Heavier precipitation tends to pick up a negative charge, while
smaller bits of precipitation get positively charged. The heavier precipitation has
a higher terminal velocity, so it falls faster, while the lighter precipitation is
held in suspension in the anvil of the cloud. Hence a combination of gravity and
terminal velocity creates the charge separation in a thunderstorm.
If the charge separation process puts several kilometers of
distance between the negative and positive charges, it will take tens of minutes for
the charged particles to work their way past the aerodynamic resistance in order to
recombine. In the meantime, positively charged downdrafts will be attracted to their
negatively charged correlates due to the electric force, while buffered from them by
the aerodynamic force.
So Figure 20 is correct but incomplete, and we need to add a
layer of positive charge all of the way around the main negative charge region. It
is motivated by all of the same forces as the negative charge region, while it is
positioned to the outside because negatively charged precipitation fell out of the
anvil earlier.
Figure 21. Toroidal flow with positive double-layer.
The significance of a positive double-layer involved in the toroidal airflow is that
it has more aerodynamic force. The negative charges in the storm are concentrated in
larger particles that exert a small force on the surrounding air. But an equal
amount of positive charge will have a lot more surface area. The loss of electrons
due to ionization shifts the matter along the solid~liquid~gas~plasma series of
physical states. Hence the charges in the positive double-layer will be found in a
larger number of smaller bits of matter. The increase in surface area then increases
the aerodynamic force. The more distributed charge will also be far more effective in
delaying the transition to turbulence, meaning faster speeds.
Considering the air speeds in question, the negative and positive charges will make
a full round-trip in the toroidal flow long before they have a chance to recombine.
And at the top of the loop, the charge separation will be refreshed by the effects
of gravity and terminal velocity.
Having good reason to believe that a robust toroidal recirculation exists in the top
half of the cloud, motivated by the thermal forces and stabilized by electrostatic
pressure, we should then consider the effects that this will have on the developing
thunderstorm.
As already mentioned, the toroidal flow will eliminate turbulence in the boundary
layers surrounding the updraft, along the bottom of the anvil, and on the inside of
the downdrafts. This will increase the speed of such flows. Interestingly, the
faster the system runs, the more effective the charge separation. Given enough time,
opposite charges will recombine, and such a structure will cease to exist. The
faster the toroid spins, the more frequently the charge separation gets refreshed at
the top of the storm. And the more the charge separation, the more powerful the
structure. So this constitutes a positive feedback loop.
And if we look at the bottom of the toroid, we see another important effect. The
inward flow will funnel all of the updrafts from lower in the storm through a single
laminar channel. Hence the reinforced toroidal flow will concentrate the energy of
numerous small updrafts into one big updraft racing to the top of the cloud.
Figure 22. Effects of organized recirculation in the top half of the storm.
A faster updraft means more air being pumped into the anvil, which will expand
faster, and which will manufacture more precipitation in a shorter period of time,
which will increase the speed of the downdrafts, which will increase the mid-level
"entrainment," which will further consolidate the updraft. So a force multiplier
(i.e., a consolidated updraft) has been added to an existing positive feedback loop,
creating a runaway system.
Note that this runaway system is not creating any energy, and thereby
violating the First Law. The energy budget of a supercell is unmistakably
thermodynamic, and any electromagnetic forces present have to be conversions from
thermal potential, or the energy budget isn't going to work out. But the proposal
here is not that the total amount of available energy in the system is being
altered. What's being altered is the rate at which work is being performed.
And there is no fixed law there, except that all of the factors have to be taken
into account, and if the circumstances favor the acceleration of the prime mover,
the whole system will run faster, until all of the energy has been expended. And we
definitely know that something is altering the rate at which work is being
performed. We just can't get there with thermodynamics alone.
To look at it another way, it's the same amount of energy, but the organized
toroidal form is consolidating all of the energy released in a small convective
complex into one single updraft. So we could have random
30 m/s updrafts in a cluster of thunderstorms covering
10 km2, or we could have one steady
80 m/s updraft, 2 km wide, in a
supercell — same energy either way. With thermodynamics alone, we just don't
have the organizing principle that will affect this transformation. But with a
little bit of encouragement from electromagnetism, the rough thermodynamic
form resolves into an organized structure. The consolidation of energy and the
reduction in turbulence then results in faster speeds, and this further encourages
the form.
So where is the mathematical support for such contentions? Typically this would be a
very reasonable question, but consider the complexity of the problem. Reliable
estimates of turbulence thresholds are derived experimentally, not theoretically. Not
being able to reproduce a supercell in a laboratory (mainly because of the
scale-dependent pressure gradient in the atmosphere), we'd have to attempt a
computer simulation with the turbulence threshold determined heuristically. The
aerodynamic forces would have to be calculated separately for the negative inner
core and for the positive double-layer, using guesswork to flesh out incomplete
charge density datasets, and then the fluid dynamic interplay between the two layers
would have to be estimated. Getting the electric force just strong enough to
influence the flow, without overpowering it, would take a lot of trial and error, as
near-infinitesimal amounts of extremely powerful forces are always tough to
estimate. And after guessing at everything, what will an exact solution
prove? It will prove merely that this might be correct. But we already knew
that.
We would prefer simulations in which we could expect more stable behaviors, and that
would mean working with moderate forces. But if the factors that produced supercells
were within normal ranges, supercells would be the norm, not the 1 in 1,000 case. So
we cannot rule out unexpected behaviors from forces well outside their normal ranges
— we must rule in only those constructs that operate at such
extremities — even if simulating them would be extremely difficult.
It's clear to all of those who understand the problem that numeric proof is beyond
the reach of current technology. So there is little that can be done. But we can
still do more than we are doing now. At the very least, we can begin constraining
ourselves to what is physically possible, which the present proposal
appears to be. The existing constructs do not meet this criterion, and the increase
in rigor would mean that we're making progress. And we can make comprehensiveness a
hard constraint. Tornadic supercells have many distinctive properties. No previous
proposal has directly addressed the great diversity of phenomena in the problem
domain. If we are now considering a possibility that passes a comprehensive range of
tests, there will be far fewer reasons to think that we don't know what we're doing.
Therefore, the reinforced toroidal form, with a negative inner core and a positive
double-layer, is proposed to be the organizing principle that initiates the
transition from a normal thunderstorm to a supercell. The section entitled "Toroids to Mesocyclones" will describe the
metamorphosis from a toroidal to a mesocyclonic flow, from which the tornado will
ultimately descend.
It cannot be overstated that this is neither an electromagnetic nor a thermodynamic
construct. It is a thorough integration of electromagnetic and thermodynamic factors
in a unified framework, producing behaviors not possible within either regime all by
itself. So it's not an unusually robust open-air thermal system, and it's not a
low-energy plasmoid in a high-friction environment. It's thermal fluxes generating
charge separations that then modulate the thermal fluxes. To understand
these systems, we have to see electromagnetism and thermodynamics as fully
intertwined sets of principles.
The study of coupled electromagnetic and thermodynamic forces is a young discipline.
Here is a quote from a recent work that describes the types of problems that are
being tackled with such interdisciplinary methods.70
Electro-Magneto-Hydro-Dynamics (EMHD) addresses all phenomena related to the
interaction of electric and magnetic fields with electrically conducting or magnetic
fluids. Electric and magnetic flow control, for example, is a challenging area of
mathematical and engineering research with many applications such as the reduction
of drag, flow stabilization to delay transition to turbulence, tailored stirring of
liquids, pumping using traveling EM waves, and many others. The application of
electric and magnetic fields in diverse branches of materials science such as
crystal growth, induction melting, solidification, metal casting, welding,
fabrication of nanofibres, fabrication of specialty composites and functionally
graded materials, or ferrofluids is recently of growing interest. Fully coupled EMHD
systems, that is, in situations where the flow-field is influenced by the electric
and magnetic fields and where these fields are in turn influenced by the flow-field,
are challenging research subjects with applications in geo- and astrophysics
(dynamo, magneto-rotational-instability, etc.). Numerical simulations of many
important processes (the growth of single crystals, metal casting for aerospace
applications, aluminum electrolysis, etc.) require sophisticated tools for coupled
fluid flow ~ heat/mass transfer ~ electromagnetic fields. In summary, computational
EMHD is a vital subject of recent research with a long list of interdisciplinary
applications and scientific problems.
The present work studies tornadic supercells as charged gases, where the gases also contain
charged liquid and solid particles. The gases obey fluid dynamic laws, though the viscosity
is modulated if the gases are charged. Electric fields also exert forces on charged
particles, which then exert aerodynamic forces on the gases. The larger particles are also
subject to gravitational and inertial forces. Heat sources and sinks alter the density of
the gases, which in the presence of gravity results in fluid motion. Such a crossroads of
all other disciplines puts this work squarely within the domain of EMHD. This paper will
then use "EMHD" to refer to this particular interaction of forces, and the framework that
emerges, when clarity requires that the regime in question be identified. At some later
date, some sort of term might be coined for this particular EMHD construct, if anyone else
begins actively developing a different treatment of the topic using EMHD principles. In the
meantime, please consider expediency and disdain for arbitrary coinages, not
presumptuousness, to be the reasons for calling this the EMHD construct.
Figure 23. Top of supercell that produced an F4 tornado in La Plata, MD, 2002-04-28, courtesy Steven Maciejewski.
Figure 24. Schematic of supercell thunderstorm, courtesy NOAA, redrawn by Vanessa Ezekowitz.
The conditions conducive to both hail and tornadoes are similar, and meteorologists
forecast both phenomena in more or less the same way, though hail is far more common
than tornadoes, so the hail outlooks typically cover more area. (See Figure 25.)
Figure 25. Similar hail (left) and tornado (right) outlooks for 2011-10-13, courtesy NWS.
Since hail and tornadoes are coupled, we can test the EMHD model of supercells by
considering how it would account for hail. At this point, the model only describes
the embryonic mesocyclone, wherein a reinforced toroidal recirculation has emerged
(while the transition from a toroidal to a mesocyclonic flow is yet to be presented
in the section entitled "Toroids to Mesocyclones"). But we also know that hail begins to form within the first 10
minutes of the thunderstorm becoming organized.71 So the model of
the embryonic mesocyclone (still in toroidal form) should be capable of
explaining hail.
Existing theory states that hail forms at the top of the updraft, where
precipitation released from the updraft falls back through the updraft, colliding
with other precipitation, creating larger aggregates.72 While it's
unquestionable that this does happen, it can't be the whole story. The
terminal velocity of precipitation when it first forms is lower than that of
dust, which follows the motion of the air first and the force of gravity
last. Furthermore, to the extent that gravity is a factor, it acts on all
of the particles in the same way. So all by itself, gravity does not create particle
collisions. If the particles were much larger, and of different sizes, they would
have different terminal velocities, and therefore would fall at different speeds,
resulting in particle collisions. But how can they collide and create larger
aggregates before there are aggregates of different sizes?
Further still, the same standard theory also states that wind shear must be present
in order for a thunderstorm to develop to extreme limits. The reason given is that
without wind shear, the updraft will be perfectly vertical, and precipitation
released at the top of the updraft will fall back down, through the updraft. When it
does, some of the precipitation will evaporate, cooling the air and creating a
downdraft right on top of the updraft, snuffing it out.37,71 Aside
from the question of how microscopic ice crystals are going to "fall through" an
updraft, this begs two more questions. First, how does precipitation evaporate in an
updraft that is already at its dew point and the temperature is still dropping
(otherwise it wouldn't be forming precipitation that can "fall back down")?
Second, the more severe the thunderstorm, the more hail it produces. If wind shear
has to be present in severe thunderstorms (to prevent capping downdrafts), wouldn't
they produce less hail? It's clear that some of the tenets in the standard
model are mutually exclusive, and that we're missing something fundamental.
First we need a framework for understanding how large aggregates of water molecules
can form, sometimes within the first 10 minutes of a cumulonimbus cloud becoming
organized.71 Then we'll ask about the specific characteristics of
hail.
The accretion of water vapor into supercooled aerosols and ice crystals, in such a short
period of time, obviously needs help from a force more powerful than just random covalent
bonding. The most likely candidate is the dipolar nature of water molecules. In the fair
weather field (100 V/m),73,74 the electric force will not affect the
translational velocity of the (as yet neutrally charged) molecules, but it will
polarize them, and this means that with respect to neighboring molecules, each will show
opposite charges to the other, resulting in an electrostatic potential between them.75,76 This will greatly increase the chance of molecular aggregation. If a crystal
lattice is already present, new molecules will contribute to the existing solid; otherwise,
they will join the supercooled aerosol.
Figure 26. Dipolar water molecules get aligned by the fair weather field, and then are attracted to each other. Green = positive; red = negative.
Still in the presence of the fair weather field, the aggregates then become dipoles
on a larger scale, showing a positive charge at the bottom (facing the
negatively charged Earth), and a negative charge at the top (facing the
positively charged ionosphere). This sets up the conditions necessary for electron
transfer in particle collisions. A larger particle falling through the field,
showing a positive charge on its bottom, will be attracted to a smaller particle in
its path, which is showing a negative charge on its top. When they collide,
electrons are transferred to the larger particle, and are absorbed by its electron
cloud. This leaves the smaller particle positively charged, which is then repelled
by the positive face of the larger particle. When the larger particle falls past the
smaller one, there are two possibilities. Either the smaller particle will fall in
with the larger particle, attracted to the negative charge at the top of the larger
particle, in which case the two particles will merge, or the smaller particle will
have been blown too far out of the path, in which case it will be left behind with a
net positive charge, and with the larger particle gaining a net negative charge.
Obviously, both of these outcomes occur, and both are easy to understand in this
framework.
Figure 27. Charge separation.
Then, as larger, negatively charged aggregates fall because of a higher terminal
velocity, the main negative charge region develops below the main positive
charge region in the storm. This field has the same orientation as the fair weather
field (between the negatively charged Earth and the positively charged ionosphere).
Hence the emerging charge separation enhances the existing field, and strengthens
the molecular/particulate dipoles, which increases the chance of collisions, which
increases the accretion rate and the charge separation process.
Such can explain the development of large water particles, and the main charge
regions in the storm. But explaining hail will take more than that. The distinct
layers in a hailstone cannot be adequately explained as simple "wet growth," in
which supercooled aerosols adhere to an existing ice crystal. Some of the literature
suggests that when the aerosols freeze, they release enough latent heat to thaw the
surface to which they adhere, creating a distinct layer. But for this to be true,
the aerosols would have to be just below freezing themselves, and hail only forming
in that part of the cloud where the temperature is within such a narrow range would
not account for the amount of hail that is actually produced. It is also
inconsistent with the simultaneous appearance of hail below the freezing line (less
than 5 km above ground), and also far above it, where the
temperatures are between -30 °C and -50 °C (8 km or more above ground).77,78 Some researchers believe that there are two separate processes
involved,71 but this begs the question of what couples those
processes such that they start producing hail at the same time, and of the same
size.
So other researchers favor the "particle fountain" idea, in which a relaxed updraft allows
precipitation to fall below the freezing line, where some melting occurs. Then, the next
surge in the updraft hoists the aggregates above the freezing line, and the liquid freezes
into a new layer. But with distinct layers only 2 mm thick, a
golfball-size hailstone (r = 22 mm) would have to go through 11 cycles
of this without falling out of the updraft, which is hard to believe (especially if it's a
severe thunderstorm, with a tilted updraft). It's also hard to believe that the "particle
fountain" would be so good at producing layers of such consistent thickness per stone, when
random surges in the updraft should produce random layering. All the more problematic is
that this puts air-cushioned hailstones, which are the best radar reflectors in the
cloud, inside the bounded weak echo region (BWER), where we should expect no hail at all.
Interestingly, recent simulations of hail-producing storms acknowledge the existence
of upper-level recirculation,78 as in Figure 28. A recirculation pattern that straddles the freezing line easily accounts for the
emergence of refrozen precipitation, in that period of time, with that many layers,
below and well above the freezing line at the same time.
Figure 28. Modelled airflow, including well-defined recirculation, in a hail-producing storm, courtesy Meteorology Press.
Consider, for example, a toroidal recirculation emerging within the first 10 minutes
of the thunderstorm achieving full depth. Let's suppose that the toroid has a
diameter of 1,000 m at that stage, with a circumference of 3,142 m. If the air is rotating at 50 m/s, it will
make the round trip in roughly one minute (3,142 m / 50 m/s = 62.84 s). At 2 mm per pass, in 10 minutes
a hailstone will grow to a radius of 20 mm. At that size it will
have a terminal velocity of 15 m/s, which
means it will still be too small to fall out of the upward component of the rotation
(at 50 m/s), but in the 1,000 m of horizontal
motion along the bottom of the recirculation (which it travels in 30 seconds), it
will fall 450 m — perhaps enough
to get it out of the recirculation. Otherwise, the hailstone can become as large as
a baseball (r = 37 mm) within 20 minutes simply by wet growth.
While upper-level recirculation is the far more likely mechanism responsible for
hail, one question is left open. It's undeniable that there is a strong relationship
between wind shear and severe thunderstorms. If it's not because of an absence of
"capping downdrafts," then what is the actual nature of the relationship?
The more likely correlation has to do with thermodynamic factors at the bottom of
the storm, rather than the top. The tilt in the updraft will cause the downdraft
to fall further from the bottom of the updraft, reducing the chance of undercutting the
updraft. A downdraft that hits the ground close to an updraft, but without
undercutting it, will actually accentuate the updraft, because it displaces warm air
that then joins the updraft with force.79
Figure 29. Wind shear prevents downdrafts from undercutting the updraft.
Combining the contentions in this and the previous section, a far more plausible
description of the general nature of supercells becomes possible.
If wind shear is present, the downdraft will not undercut the updraft, and
an endless supply of thermal energy in the lower troposphere can feed the
storm in the upper troposphere. Now the storm can last much longer than an
hour.
The longer the storm lasts, the more positive charge accumulates at the top
of the cloud, and the more negative charge is held in suspension in the
middle of the storm, establishing powerful main charge regions.
If the air is charged, electrostatic forces will encourage the establishment
of an organized toroidal flow that will consolidate the updraft and delay
the transition to turbulence, resulting in a much faster flow, and a more
powerful toroidal structure. As the recirculation straddles the freezing
line, hail begins to form.
The far more powerful updraft will then be able to pull in air from a much
wider area, and the single-cell storm will grow to enormous proportions.
Note that in EMHD, electromagnetism and thermodynamics are peers. Neither dominates,
and neither can be forgotten, in a complete description of the phenomena.
Figure 30. Supercell that dropped hail accumulating to 12 inches on the ground in Chaparral, NM, 2004-04-03, courtesy Greg Lundeen.
So far, the EMHD model has a toroidal recirculation of the air in the top half of the storm
that creates a runaway system. Yet the defining characteristic of a supercell is its
rotating updraft — the mesocyclone.39 (Its name belies the
ancient assumption that hurricanes, supercells, and tornadoes were all manifestations of the
same principles, on 3 different scales, and all were called "cyclones."80 We now know that these are fundamentally different phenomena, yet the names persist.) And
there is a fundamental difference between toroidal and mesocyclonic airflows.
There is a growing body of evidence that mesocyclones develop in the upper portion
of the cloud, sometimes producing well-defined hook echoes 5 km above the ground, and then they extend or migrate down to the base of the
storm.40,66,67,68,69 Existing models do not take these data
into account. An uplifted crosswise vortex, or a streamwise vortex on the leeward
side of an updraft, would have the rotation begin in the bottom half of the storm,
if these were, indeed, realistic models anyway. So the EMHD model, focusing on the
top half of the storm as the origin of the mesocyclone, is starting in the right
place. But the data tell us that if a toroidal airflow does develop, it
evolves into a mesocyclonic flow, before the structure descends.
Assuming that a powerful recirculation has become organized, and assuming that wind
shear is present in the top half of the storm, rotating mid-level "entrainment" is
easy to understand. Suppose that the mid-level winds are from the south, and the
top-level winds are from the west. Air pouring out of the updraft will get blown to
the east, and more downdraft air will fall on the east side of the system. As this
downdraft air is drawn back toward the updraft, the southerly winds offset the air
to the north. Air being pulled westward, but also being offset to the north on the
way, will then spiral counter-clockwise toward the updraft. Figure 31 shows the dominance of CCW inflow, where the black dots represent
sources of air (i.e., the downdrafts), and where the air converges on a central
vacuum (i.e., the updraft). In a non-linear simulation, this would resolve into a
cyclonic pattern.
Figure 31. Flow lines at bottom of toroidal airflow (mid-level entrainment), in plan view, with wind shear. Fluid dynamics applet by William Devenport.
Figure 32 is a rough representation of the general form of a
toroidal recirculation that has been skewed and twisted by wind shear. If the
lower-level winds are traveling in the +Y direction, and the upper-level winds in
the +X direction, the updraft (+Z) will tilt in the +X direction, while along the
bottom of the recirculation, air will be offset in the +Y direction by the
lower-level winds, inducing rotation. The algorithm used to generate the image then
makes a continuous geometric pattern out of it.
Figure 32. Skewed and twisted toroid.
Functionally speaking, the skewed and twisted toroid will have more or less the same
properties as a simple toroidal flow. It is still motivated by the updraft inside,
the anvil above, and the downdrafts to the outside, with mid-level "entrainment"
closing the loop along the bottom. We also shouldn't expect the twisted toroid to be
any worse in funneling all of the updrafts below it into the center. In a cyclonic
regime, the net effect on lower air rising up into the mesocyclone will be to funnel
the air toward the center, even if there is also a rotating counterpart to the
motion.
It's even possible that the rotating sheath accentuates the updraft.
Negatively charged precipitation in the rotating recirculation will be centrifuged
outward. We would expect it to be ejected tangent to the rotation, except for the
fact that it experiences an electrostatic attraction to the positive double-layer,
which at this point in the recirculation is the inside layer. The net effect is that
the positive double-layer will be pulled outward, to the extents of what the drop in
hydrostatic pressure allows. The limiting factor is how fast the sheath can pull in
air from below to satisfy the vacuum created by the centrifugal force. In other
words, the rotation will increase the suction at the base of the mesocyclone.
Note that this actually represents a fundamental reconception of the nature of a
mesocyclone. In the standard model, a mesocyclone is a rotating updraft. But when we
observe that the mesocyclone gets established in the top half of the storm, this is
untenable. As noted in the section entitled "Electromagnetic Toroids", the updraft begins at the base of the
storm, where the primary release of latent heat is 7.5 times greater than the
secondary release in the middle of the storm. So we truly have no reason to believe
that there will be any Venturi Effect entraining mid-level air into the updraft,
much less the kind of powerful entrainment that could develop a well-defined
cyclonic inflow pattern several kilometers wide, 5 km above the ground. Rather, the "entrainment" is actually just the
bottom segment of a continuous recirculation. Once the air gets to the center, it
doesn't get pulled into the updraft — it forms a sheath around it. This means
that it's not the updraft that is rotating at all — it's the "entrainment"
that is rotating, and the mesocyclone is a skewed and twisted toroidal boundary
vortex that consolidates the updraft and eliminates friction between it and the
surrounding air.
Once a mesocyclonic flow gets established in the top half of the storm, it then
extends and/or migrates downward. As airspeeds increase, the
mesocyclone is able to pull air from lower in the storm, where there is far more
energy. (The release of latent heat at the bottom of the storm, where water
molecules go from gas to liquid, is 7.5 times more powerful than the liquid-to-solid
release in the middle of the storm.) Hence we can expect airspeeds to increase as
the size of the mesocyclone grows.
As the mesocyclone extends downward, the structure of the recirculation changes as well. In
the top half of the storm, we can expect enough wind shear to get the downdrafts to be
offset from a concentric circle around the updraft. But if the downdrafts begin at the top
of the storm, and fall all of the way to the bottom, there will be enough wind shear to get
them to fall entirely on the leeward side of the updraft. The next four figures illustrate a
metamorphosis, from a toroidal recirculation in the top half of the cloud, to a mature
mesocyclone dominating the entire storm.
Figure 33. Toroidal flow in upper half of storm.
Figure 34. Wind shear skews and twists the toroid into a mesocyclone.
Figure 35. Mesocyclone extends downward. Note that wind shear carries all of the downdrafts to the leeward side of the storm, where they merge.
Figure 36. Mesocyclone achieves full height.
Figure 37 shows a 3D representation of the reflectivity within a
tornadic storm. (Red means > 50 dBZ; orange means 43~44 dBZ. Note that this scan
leaves out the bottom 1 km or so of the storm, since Doppler
radar can't see below 0.5° above the horizon, because of ground clutter issues.
Nevertheless, the base of this storm was about 1 km above the
surface, so we're not missing much, except the rain under the hook echo, and of
course, the tornado.) The reflectivity thins out at the top of the updraft, so we
can't see the complete loop, but the updraft is clearly visible, and we can see the
precipitation in the forward flank downdraft feeding directly back into the updraft.
The tubular structure of the recirculation (sometimes called "cave channels"77) is also clearly visible on the right-hand side of the image.
Figure 37. Volumetric reflectivity of the storm that produced an F5 tornado in Moore, OK, 1999-05-03, courtesy GRLevelX.
At first blush, the conventional thinking on the structure of the mature mesocyclone
seems intuitively accessible. A powerful updraft is pulling air from all around, and
cyclonic inflow patterns are common in nature. But the mesocyclone in Figure 37 was running at full speed at the time of the scan (with an F5
tornado in progress), and the source of the energy was downdraft air, being drawn
upwind, from 10 km away, faster than the storm was
pulling warm, moist air in through the flanking line? Wet downdrafts extinguish
updrafts, if the rest of what we know about thermodynamics is true. And it makes no
sense whatsoever that a channel of air is getting pulled against the prevailing
winds into a low pressure.
Understanding this scan in mechanistic terms requires that we openly acknowledge
that the updraft doesn't have a right to pull downdraft air back into the updraft
from that far away. Such constitutes direct evidence of the presence of factors
other than just simple thermal buoyancy. In fact, what we see here is a phenomenon
known as "channeling," wherein a band of air is being preferentially pulled
through other air. In fluid dynamics, this is only possible when there are
major differences in viscosity, and the low-viscosity substance experiences less
friction tunneling through the high-viscosity substance, even as it travels a
greater distance. That begs the question of what could cause such a big viscosity
difference in the air. If the air is charged, electrostatic repulsion
prevents the particle collisions that instantiate friction, allowing it to flow more
freely. So this has to be charged air.
Then we just have to account for the fact that the updraft is running at extreme
limits, with its only visible means of support being negatively buoyant downdraft
air. There's no way to make that energy budget work, so there has to be
another source of energy, and there has to be a way to keeping the cold
downdraft air from mixing with the warm updraft air, where it would dampen its
buoyancy (if not extinguish it). The only possible solution is that the charged
downdraft air isn't actually getting drawn into the updraft, but rather, is just
forming a sheath around it. The source of energy is warm, moist air approaching from
the south in the flanking line (which doesn't appear in the scan). This air cannot
be flowing into the hook echo, where it would be layered in with the cold downdraft
air, resulting in minimal net buoyancy. Rather, the warm air has to be flowing up
into the sheath from below, without mixing in with the sheath. The sheath then
accentuates the updraft, as the centrifugal force of its hydrometeors lowers the
pressure in the updraft core (as mentioned in the previous section).
A hodograph is a 2D graphic that represents differences in wind directions and
speeds through the altitudes.69 If we draw a vector from the
origin of the coordinate system (x = 0, y = 0) in the direction of the wind, and at
the appropriate length, for each elevation, and then connect the ends of the vectors
with a polygon, we get a "hodograph" as depicted in Figure 38.
The figure shows that the surface winds were traveling to the WNW; the winds at 2
kilometers above the surface were to the N; at 4 km to the NE, etc. So in this case,
there was a smooth progression of wind changes through the altitudes.
This pattern of shifting winds is favorable to the development of a mesocyclone. The
critical factor appears to be that the wind direction continues to change in a
smooth progression through the altitudes. If the winds reverse direction, producing
a zigzag hodograph, mesocyclones are less likely to develop.
The mechanistic reasons for the significance of this wind pattern have not been
identified, but the EMHD model offers a suggestion. Robust recirculation in the
presence of wind shear will induce rotation, as presented in the previous sections.
Since mesocyclones appear to be born in the top half of the cloud, a consistent wind
shift from 5 km up to 10 km would be the
critical factor there. Then, for the mesocyclone to mature to a full depth of 10 km, the shearing conditions have to be the same throughout the
altitudes, otherwise the rotation will be perturbed, and the mesocyclone will fall
apart. Robust recirculation in a mature mesocyclone, where all of the downdrafts
fall on one side of the storm and the "entrainment" has to flow upstream toward the
updraft, is only possible if the air has a lower viscosity. As the mesocyclone
descends, if the wind directions alternate through the altitudes, the flow will
become turbulent, negating the effects of a reduced viscosity. The turbulent flow
then no longer channels through the surrounding air, and the laminar structure that
was organizing the updraft is gone.
The principles of thermodynamics are scale-independent. Whatever occurs at one scale
will occur at another, and so long as we scale distances and speeds by the same
factor, everything should match up perfectly (unless other factors come into play
that are not scale-independent).
This is a problem for the thermodynamic approach to mesocyclones, in that we have a good
understanding, in purely thermodynamic terms, of a vortex at a different scale — the
tropical cyclone — but the numbers don't match up.
Tropical cyclones provide a perfect example of the amount of energy that can be
stored in warm, moist air, and the rate at which that energy can be released.
Tropical cyclones form over the ocean, where surface friction is at a minimum, and
the amount of available water vapor is at a maximum. Such storms begin to lose
energy as soon as they come ashore. Maximum sustained wind speeds in a tropical
cyclone are 85 m/s.81 The amount of energy
present in the atmosphere would be capable of wind speeds even higher than that, but
the faster the winds, the lower the pressure of the inflow, and this encourages
water vapor to condense before it gets to the updraft in the center of the system.
The release of latent heat forms updrafts, and ultimately thunderstorms, in the
feeder bands. As a result, a lot of the energy in the storm is "wasted" by
turbulence in the feeder bands, and this places an upper limit on how violent the
storm can become.
But mesocyclones are obviously a different breed. Despite forming over land, where the
surface friction is far greater, and with less moisture, mesocyclones are capable of wind
speeds over 150 m/s — roughly double that of a tropical cyclone.
For some reason, the limits set by turbulence in the feeder bands do not apply to
mesocyclones.
The general thinking in the meteorological community is that unlike tropical cyclones,
mesocyclones feed on energy that has built up below a cap layer, and where there is a major
difference in temperature and humidity between the lower and upper tropospheres. Such
conditions are short-lived and relatively localized, but represent a more significant
(local) potential than is present anywhere in a tropical cyclone. That much is true. But
that still does not explain the moderate speeds in the flanking line.
The only reasonable explanation for the far greater speeds in a mesocyclone is that
newly released energy is contributing to an existing internal recirculation. In
other words, the rate of inflow and the internal rotation do not have to be directly
related. The speed in a supercell's flanking line is analogous to the speed in a
tropical cyclone's feeder bands, and the one scales up to the other appropriately
(until the tropical cyclone's feeder bands develop their own updrafts). The actual
speeds within the mesocyclone are way out of proportion to the inflowing
speed in the flanking line, proving that these structures are indirectly related.
This only makes sense if the mesocyclone is a sheath around the updraft that moves
with it, but does not mix with it.
Predicting the direction and speed of a supercell is obviously of extreme
importance, as the general public needs to be informed of the impending danger. But
the movement of a supercell is surprisingly tough to predict accurately. As a
result, storm-based tornado warnings have to allow for a wide margin of error. (This
is masked by the trapezoidal warnings issued by NWS. More honestly, they would be
triangles, starting at the mesocyclones and projecting at the angle of the margin of
error.)
A rough rule of thumb is that a supercell will travel in a direction that is 30°
to the right of the average mid-level winds, and at 75% the speed of those
winds.82 More sophisticated algorithms have been developed for
predicting storm motion given the direction and speed of the mid-level
winds,83 but with only marginal improvements in
accuracy.84 The loose relationship between winds and storm motion
suggests that we're missing something fundamental.
Another aspect of supercells lacking a good explanation is the fact that the
updrafts tends to be perfectly straight, with a 15° tilt because of wind
shear.85 This is anomalous because wind speeds typically increase
with altitude (see Figure 38), and therefore we would expect
the updraft to curve as it ascends. When the updraft enters the jet stream, at
roughly 10 km above the surface, we would expect the curvature
to be dramatic. But this is not what typically happens.
Electromagnetism offers an explanation for the straightness of the updraft, and in
so doing, enables a new way of predicting storm motion that might be more accurate.
Electrostatic repulsion in the charged sheath around the updraft will oppose kinks
in the sheath. Since the electric force falls off with the square of the distance,
the increase in electrostatic pressure on the side of the kink that is getting
compressed will be far greater than the decrease on the side that expands. Hence the
sheath is stable in the straight form.
Figure 40. Effects of buoyancy, wind shear, and EM on the shape of the updraft.
This goes on to offer an explanation for the 30° offset in the direction of the
storm relative to the mid-level winds. If we take a second look at the typical wind
directions and speeds, 30° to the right of the mid-level winds is typically the
direction of the jet stream. By thermodynamic standards, there's no way that the jet
stream could be influencing the direction of the storm, so no one looks at that, but
by electromagnetic standards, this is easily possible. If the updraft has a powerful
force that is keeping it straight, and if the jet stream is exerting a lateral force
on the updraft at the top, then this will exert a force on the bottom of the
updraft, dragging it along wherever the top is being pushed.
Analogously, if a pencil is suspended by one end under water, the pencil's buoyancy
will tend to keep it pointed straight up. If the water is moving at the top of the
pencil, the pencil will lean in the direction of the movement. Because of its
buoyancy and because of its rigidity, the pencil will transfer the force to the
bottom, and the entire pencil will move in the direction of the water, even if the
prime mover is only acting on the top of the pencil.
Similarly, the updraft in a supercell is buoyant, so it would otherwise tend to be
perfectly vertical. If the top of the updraft is in the jet stream, the updraft will
be tilted. Because of the updraft's buoyancy and because of its rigidity, and
because the jet stream is so much more powerful than the lower-level winds, the
bottom of the storm will tend to follow the top, rather than the top following the
bottom as we would otherwise expect.
This will be true to the extent that the mesocyclone is well-developed in the jet
stream. Weaker thunderstorms, even in the same general vicinity, will tend to follow
the lower-level winds. So called "left-moving" supercells (that travel in a
direction that is to the left of what is expected) might then be "left-movers"
simply because they are not as vertically developed as "right-moving" supercells. In
other words, normal thunderstorms, and low-topped supercells, will tend to be
"left-movers." Fully developed supercells will tend to be "right-movers." In the
transition from a normal thunderstorm to a supercell, the storm will tend to make a
right-hand turn compared to its original course.86 As the storm
weakens, it will turn back to the left. All of these are well-known behaviors,
though thermodynamics cannot make the connection, while the EMHD model can.
Figure 41. Strong storm follows the jet stream.
For example, during the tornado in Moore, OK, on May 3, 1999, the upper-level winds
were from the southwest, while the lower-level winds were from the south. The storm
tracked in a northeast direction during its most intense stages, following the
upper-level winds. As it dissipated, it turned to the north, no longer controlled by
the jet stream and then moving in the direction of the lower-level winds. This was
true during its final dissipation stage, as well as during a brief dissipation
period as it crossed the Canadian River.
Figure 42. Oklahoma City, OK
Figure 43. Upper-level winds during F5 tornado in Moore, OK, courtesy Unisys.
Figure 44. Lower-level winds during F5 tornado in Moore, OK, courtesy Unisys.
Figure 45. Moore, OK damage path, courtesy Google Maps. (pink = F1, orange = F2, red = F3, dark red = F4, magenta = F5)
Here is similar information from the rash of tornadoes in Kansas on May 4, 2007 (one
of which devastated Greensburg).
Figure 46. Greensburg, KS
Figure 47. Upper-level winds during EF5 tornado in Greensburg, KS, courtesy Unisys.
Figure 48. Lower-level winds during EF5 tornado in Greensburg, KS, courtesy Unisys.
Figure 49. The first 15 damage paths in south-central Kansas, 2007-05-04, courtesy Leslie Lemon.
If the contentions in this section are correct, then a pre-existing knowledge of the
wind speeds and directions, combined with real-time magnetometer readings to
determine the amount of EM force present, and its vertical extent, would produce
better short-term tornado track predictions.
Note that the curl at the end of the Greensburg damage path was due to a surge of
cold air at the intersection of the warm, cold, and occluded fronts that wrapped
around the storm so rapidly that it created an eddy. These will always be impossible
to predict far in advance, and even predicting such behaviors minutes in advance
would take an array of thermometers and anemometers within
a couple of kilometers of the storm, and a team of scientists
to analyze the data in real time. So unless the storm is the subject of a large
field study, we'll never know when these curls are going to happen.
The largest hail produced by supercells can be over 100 mm in
diameter. The final aggregate is a one-time consolidation of smaller hail, where the
individual components are rarely more than 25 mm across.
Figure 52. Largest hailstone ever recorded, 178 mm in diameter, from Aurora, NE, 2003-06-22, courtesy NOAA.
Doppler radar clearly reveals the presence of hail around the outside of the updraft. But
it's hard to imagine how even small hail could have risen along with the updraft without
being centrifuged out of it. With rotational speeds in the mesocyclone approaching 150 m/s, the hail would be spun out and distributed on the ground in a
360° pattern. This, of course, is not what happens — hail typically falls more or
less along the inside edge of the hook echo, with the larger hail falling nearer to the
mesocyclone.
The only possible explanation for the lack of centrifugal ejection is that there is
another force that is opposing it. That other force can only be
electromagnetism. If the mesocyclone is a sheath around the updraft, and if the
sheath has an outer, negative layer and an inner, positive layer, the electric force
will keep charged particles (such as hail) within the sheath.
The only hail that does fall to the ground is not getting centrifuged
outward in all directions, but rather, is falling out of the hook echo. Furthermore,
larger hail falls nearer the mesocyclone, while smaller hail falls in the forward
flank core. This is anomalous because the larger hail has a higher terminal
velocity, and all other factors being the same, we would expect it to break out of
the recirculation pattern earlier than smaller hail. Hence the stratification
should be from larger hail in the forward flank core to smaller hail nearer
the mesocyclone. But the larger the aggregate, the more net charge it can support.
And while the terminal velocity and the momentum of the hail increase as
straight-line functions of size, and so does the net charge, the effective force of
the electric field increases far more rapidly, as the fundamental force is so much
more powerful.
Hail-producing thunderstorms, including supercells, often have a distinctive green
color.87,88,89 (See Figures 54 and
55.)
The standard explanation for this is that light is reflecting up from green
vegetation on the ground, and then getting reflected back to us by the cloud.90 But this does not explain why this happens even if there isn't much
vegetation in the area,87 nor does it explain such robust
reflectivity in the shade of a huge thunderstorm. It also does not explain why the
effect is limited to a small area, between the main rain area and the central
updraft.
Figure 54. Blue-green supercell in Hagerman, NM, 2004-10-05, courtesy Steven Johnson. The patch of green vegetation responsible for the cloud's color is clearly visible in the foreground.
Due to the brightness of this color, another common explanation is that this is
skylight that is making its way through voids in the cloud, and then getting
scattered when it exits out of the bottom.91,92 But Doppler radar
reveals that the main rain area is the densest region in the storm, so we should not
expect any sunlight to make it through this region. Furthermore, the effect
is pronounced even in the late afternoon or early evening, when the Sun is low in
the sky and the intensity of the blue light in the atmosphere is waning.
Figure 55. Blue-green supercell with a tornado, wall cloud, and tail cloud, in Big Springs, NE, 2004-06-10, credit Eric Nguyen, courtesy Corbis Corporation. Click the image to watch the associated video.
Identifying the microphysical processes responsible for a luminous color is a
complex endeavor, but one sure source of photon emission is the capture of an
electron by a positive ion. In order for this to be happening enough to create
visible luminosity, there would have to be a lot of ions picking up free electrons.
And, in fact, there is reason to believe that this is happening between the main
rain area and the central updraft. Studies have shown that while the precipitation
that falls to the ground originates from a region in the cloud that is predominantly
negative, outside of the cloud the precipitation has a predominantly positive
charge.21,93 This means that something is stripping the electrons
from the falling precipitation.
There's really only one possibility here. The precipitation would have to pass
through positively charged air, losing electrons in the process. This, then,
constitutes one of the lines of evidence in support of the contention that there is
a positive double-layer surrounding the negative charge stream. And the electron
exchange accounts for the luminosity.
So we just have to look at the emission spectra for the elements abundant in the
atmosphere (hydrogen, nitrogen, and oxygen), to determine which atoms are the most
likely sources for this color. Both hydrogen and nitrogen have emission lines in the
blue~green band. These bands dominate the actual emissions because a wider variety
of atomic events can produce shorter wavelengths of photons.94
Figure 56. Emission spectra for hydrogen, nitrogen, and oxygen, courtesy Joachim Köppen.
Please note that contemplating the nature of green thunderstorms is heresy. Consider
the following quote from Scientific American.95
Research on green thunderstorms is limited and not well funded. As Penn State's
Craig Bohren says, this is "not exactly a hot topic of research. Indeed, being
curious about them can be hazardous to one's career." For example, the small grant
from the National Science Foundation for the portable spectrophotometer Frank
Gallagher used was derided by then Speaker of the House Newt Gingrich's office, and
by Richard Pombo, then a Republican congressman from California, who denounced
Bohren in the Congressional Record.
Yet thunderstorms are natural phenomena, as worthy of study as any other, and
therefore, the investigation shall proceed.
It seems that many distinctive characteristics of supercells become easier to
explain when electromagnetism is taken into account. But by far the most
distinctive characteristic of these storms, and the least explicable with
thermodynamics alone, is tornadoes.
Tornadoes are typically thought to be simple suction vortexes responding to the low
pressure under the updraft in the thunderstorm. So we should start with a review of
the properties of suction vortexes.
Air responding to a low pressure tends to converge straight toward the low pressure from all
directions, with kinetic energy being inversely proportional to the square of the distance
from the source of the low pressure. But if, for whatever reason, the inflow was already
traveling in another direction, it will split the difference between its existing momentum
and the force of the low pressure, resulting in an inward spiral.
The tangential velocities in such a vortex are typically approximated with one of the
Rankine formulas, which states that the velocity outside the vortex wall decreases with the
inverse of the radius, asymptotically approaching zero at an infinite distance from the
center.96 The inward acceleration comes from the low pressure adding a
centripetal vector to the existing spiraling vector, resulting in a longer vector. Yet this
increase, as the hypotenuse in a vector addition, is a lot less than the increase in
velocity in a radial inflow, where the centripetal force adds a vector that is parallel to
the existing motion. So in a radial inflow, velocity varies with the inverse of the
square of the radius, while in a cyclonic inflow, velocity varies just with the
radius.
At the vortex wall, the spiraling inflow achieves a circular path around the low pressure
core, and never reaches the center. While the low pressure (and thus the centripetal force)
varies with the inverse of the square of distance, the centrifugal force varies with the
square of the velocity over the distance, and the velocity increases with proximity to the
vortex wall. When the centrifugal force becomes equal to the centripetal force, the air can
move no closer to the center.
centripetal force = 1 / radius2
centrifugal force = mass × velocity2 / radius
The centripetal/centrifugal equilibrium will always be achieved at some distance from the
center if there is any angular momentum at all. It may be a wide vortex, or a narrow one,
but the centrifugal force will never let the air get all of the way to the center. As a
consequence, the low pressure at the center goes unsatisfied, and the vortex projects away
from the source of the low pressure in search of air that can satisfy it (i.e.,
Helmholtz's first theorem). Essentially, the low pressure gets "piped" through the vortex,
with the centrifugal force creating an airtight seal that keeps the low pressure inside, and
with ambient pressure just outside the vortex wall. In a fluid with no viscosity (and hence
no friction to oppose the rotation), the length of the "pipe" is limited only by how far it
can extend and still find air with any angular momentum at all. Practically speaking, the
vortex will hit a boundary first (i.e., Helmholtz's second theorem). At the boundary, the
vortex is truncated.
All real gases (such as the atmosphere) have viscosities, so we need to consider the effects
of friction, which dissipates energy away from its source. From this we know that the low
pressure will relax with distance from the source of the low pressure.
To understand why, let's imagine a train, where the engine pulls all of the cars, analogous
to the way a low pressure pulls air. But let's imagine that the cars are connected with huge
bungee cords, instead of the standard mechanical couplings. From a stopped position, when
the engine is first engaged, it starts moving, which applies tensile force to the first
bungee cord. This force is countered by the inertial force of the first car, so the car
accelerates slower than the engine. Since its speed is less than the engine, it applies less
tensile force to the car behind it than is being applied to it by the engine. And the second
car applies even less to the third car. Thus during acceleration the tensile force relaxes
with distance from the engine. The same is true if the "tensile force" is low pressure
accelerating air, where anything that impedes the flow of air (e.g., inertia, or friction)
also impedes the propagation of the low pressure back through the air.
So the friction encountered by the vortex as it rotates in the air causes the low pressure
to relax with distance from the source of the low pressure. This means less centripetal
force, so the vortex will expand with distance from the source of the low pressure.
In a suction vortex, there are two different relaxation regimes: one for the friction in the
air itself, which is very slight, and another for the skin friction at the mouth of the
vortex, which is far greater. An EF1 tornado, with a height of 350 m,
a diameter of 35 m, and rotating at 45 m/s, will
only lose about 1,000 watts of power due to friction in the air, but the same vortex will
lose about 1,000,000 watts to skin friction at a solid boundary.97 So the
friction in the air itself is almost nothing compared to the friction at the ground. As a
consequence, the low pressure loses little energy as it propagates down through the main
body of the vortex, producing a relatively straight "throat." But skin friction at the
ground dissipates the low pressure rapidly, producing a flared radius at the bottom. Only
when the inflow detaches from the boundary does it begin to feel the full force of the low
pressure. Hence the spiraling inflow finally gets tightened into a circular rotation at the
mouth/throat interface, well above the boundary, where the Rankine acceleration results in
the fastest wind speeds.
Figure 58. Rankine vortex, with the radius of boundary detachment shown as a red dashed line.
The following images clearly illustrate the widening of a suction vortex with distance from
the source of the low pressure. Note that the turbulence at the bottom is an artifact of how
the smoke or steam is produced, in excess of the demand from the suction vortex. (See this for a high-resolution image of a vortex at the same location as in
Figure 60.)
Figure 64. Suction vortex, courtesy Michael Ellestad.
Figure 65 uses smoke entering from the side of the apparatus, which
makes the streamlines a bit easier to see. Notice that boundary separation occurs before the
vortex has completed its final tightening into its smallest radius. Also notice that nowhere
in the flow field are there any sharp corners — the air always transitions smoothly
from its existing momentum into a response to a new force acting on it. So the horizontal
cyclonic inflow maintains its angular momentum while the vertical velocity gradually
increases in response to the low pressure at the top of the apparatus.
Figure 65. Tornado model, courtesy Instructables. Click the image to watch the associated video.
Since the principles of fluid dynamics are scalable, everything in the previous section
should hold true for vortexes in the atmosphere. But there is one fact that Helmholtz didn't
take into account when he said that vortexes always project to a boundary. In the
atmosphere, there is a density gradient that alters the aspect ratio of vortexes. In the
1 km from the cloud base down to the ground, the density of the air
increases about 15%. So as the vortex spins up, and the "centrifugal seal" causes it to
project downward in search of air that can satisfy the low pressure, it is projecting into
heavier and heavier air. The effect of the opposing force of gravity is the same in
principle as a solid boundary — the low pressure cannot be satisfied by air from
underneath, so it looks laterally for new air. As a consequence, the "mouth regime" begins
earlier than expected, sometimes directly at the cloud base. The flow field is sometimes
visible, in the form of a wall cloud, as in Figure 66. (For extensive
collections of wall cloud photography, see Sam Barricklow's page, and
Roger Edward's page.)
This is represented schematically in Figure 67, and computational fluid
dynamic simulations confirm that this is expected behavior for a suction vortex in a density
gradient.96
But to whatever extent laboratory suction vortexes and in situ wall clouds make
sense, tornadoes do not. Instead of the vortex converging in the direction of the flow,
because of an increasing centripetal force with proximity to the source of the low pressure,
a tornadic vortex diverges in the direction of the flow. This is because the lowest
pressure in the vortex is at the lower boundary, as far as it can get from the source of
the low pressure, generating the greatest centripetal force, and therefore the tightest
radius. The vortex then expands in the direction of the flow, as the centripetal force
relaxes with proximity to the source of the low pressure (which doesn't make
sense). This is an apparent violation of the 2nd law of thermodynamics, and
contrary to everything we know about suction vortexes. (See Figure 68.)
Figure 68. F3 tornado that has just destroyed a house larger than itself in Mulvane, KS, 2004-06-12, credit Eric Nguyen, courtesy Corbis Corporation.
The difference here isn't just an idle curiosity. With the lowest pressure at the ground,
the inflow undergoes all of the Rankine acceleration before detaching from the
ground. This is the source of the tornado's destructive power. So it's not just a
question of what we're missing as concerns the Second Law — it's a search for the
factors that make tornadoes possible. The two most powerful mesocyclones on record
didn't even spawn tornadoes, much less damage anything on the ground.98,99 That we can understand, because the density gradient combined with skin friction at the
ground should generate a "mouth regime" with a very low energy density at the
ground. But then weaker mesocyclones have produced EF5 tornadoes that leveled everything in
their paths — without the "mouth regimes" that should have precluded such energy
densities.
On further scrutiny, the differences between standard suction vortexes and tornadoes simply
continue to pile up. Next we can wonder why sometimes there is a wall cloud and a
tornado active the same time. (See Figures 69 and 70.)
Figure 69. Tornado under wall cloud near Anadarko, OK, 1999-05-03, courtesy NOAA.
So there's a bimodal flow field,100 as already shown in Figure 67, and again in Figure 71. If the mesocyclone is the
source of the energy, and if its inflow has angular momentum, a vortex will form. But how
does the tornadic vortex form inside the mesocyclonic vortex? If the air is
responding to the same low pressure, it will respond in the same way — air doesn't
split off into a separate regime unless there is a reason. So what is that reason? In the
projected mesocyclone model, there isn't any, meaning that it doesn't even acknowledge the
question.
Figure 71. Airflow in a suction vortex versus a tornado vortex.
The gap between the standard model and reality widens to an impassable chasm when we
consider that 20% of all tornadoes descend from thunderstorms that don't even have
detectable mesocyclonic rotation.54 So the actual relationship between
mesocyclones and tornadoes is indirect at best. If we are to understand tornadoes, we have
to ignore any sort of vortex that may (or may not) be present inside the cloud, and study
just the tornadoes themselves.
When we do, the form of the energy release is the toughest question. If the energy source
was in the cloud, the energy density would relax as it projected down to the ground. Since
the energy density in a tornado is greatest at the ground, and relaxes in the direction of
the flow, we know that the source of the energy has to be at or near the
ground.97 The 2nd law of thermodynamics is not wrong. What's
wrong with the study of tornadoes as standard suction vortexes is with the assumption that
they are standard suction vortexes (which would have the energy source in the direction
of the flow, and which clearly is not the case in a tornado).
Some scientists believe that the near-ground energy is latent heat from the condensation of
water molecules in the vortex wall (like a tropical cyclone).101 As we'll
see, latent heat can provide plenty of energy, but not in the correct form. Let's assume
that the ambient temperature is a sweltering 40 °C, and that the
relative humidity is 100%. The lowest pressure drop ever recorded in a tornado was 100 mb
below ambient.102,103 That would lower the temperature to roughly 10 °C, forcing the condensation of most of the water vapor, and the
release of latent heat.
With that much heat being released into that much air, we can then calculate the
temperature increase, given that raising the temperature of 1 m3 of air by 1 °C in 1 second requires approximately 1,340
watts.
watts per cubic meter = 94,117,000 W / 1,000 m3/s = 94,117 W·m3·s
temperature difference = 94,117 W·m3·s / 1,340 W·°C·m3·s = 70.24 °C
Knowing the temperature difference, we can then find the pressure at which a parcel
of air at such a temperature will achieve equilibrium in the atmosphere. In other
words, the temperature increase will cause the gas to expand, which will reduce its
density, giving it the buoyancy necessary to rise, until it reaches the altitude at
which that's the normal pressure. The easiest way to find this pressure is to simply
find the ratio of the temperatures before and after such heat was applied, and to
multiply the standard atmospheric pressure by that ratio.
temperature = standard + difference = 15 °C + 70.24 °C = 85.24 °C = 358.39 K
temperature ratio = standard / resultant = 288.15 K / 358.39 K = 0.804
resultant pressure = standard × ratio = 1013.25 mb × 0.804 = 814.67 mb
Knowing the pressure, we can then find the altitude. We could do this with the ideal
gas laws, or we could just use a convenient algorithm that works just for the
troposphere. Note that this assumes a standard atmosphere (i.e., without the
transient temperature and pressure gradients normally associated with
thunderstorms), but we don't need to know the exact altitude — we just want to
get an idea of how buoyant the air will be, and the height through which the energy
conversion will occur.
1.8 km is roughly twice the height of a typical tornado, so we
clearly have enough thermal energy for a robust updraft within the tornado.
But this won't explain the extreme low pressure at the base of the tornado. The reason is
that the release of latent heat is a gradual process, and there is no way to get all of the
energy released all at once at the ground level. When water molecules condense, they release
heat into the surrounding air. This halts the release of latent heat, as the hotter, drier
air is now well above its dew point. The hotter air expands, which makes it less dense,
which gives it the buoyancy necessary to rise. This carries it up to an altitude where there
is less pressure, which allows it to expand even more, which lowers the temperature.
Then the air hits its dew point again, and more water vapor condenses, releasing
more latent heat. But without the effects of the pressure gradient in the atmosphere,
condensation is a self-extinguishing process. Hence a flow field motivated by latent heat
simply mimics air responding to an even lower pressure aloft, and the original question
concerning the extreme low pressure near the ground is left unanswered.
As conventional meteorology offers no other conversion that could be occurring that
close to the ground, and which could release that much energy, the only other
possibility is that the conversion involves the only other force present, which is
electromagnetism.
Several EM theories of tornadogenesis have been proposed, but they're in as much
trouble as the thermodynamic theories.104
The most widely known EM theory maintains that tornadoes are caused by weak but sustained
electrostatic discharges.105,106,107,108,109,110 This would make tornadoes
similar to lightning, but with a fundamental difference. In lightning, the electrostatic
potential builds up to the breakdown voltage of the air, and then an arc discharge occurs.
But in a tornado, the contention is that a discharge gets organized below the
threshold for lightning, and that once it gets going, it keeps going, preventing the
potential from building up to the threshold for lightning, while enabling the effects of a
sustained discharge to emerge.111 In other words, lightning starts with the
simple movement of electrons through the air, responding to an electrostatic potential
(i.e., a Townsend avalanche). This electric current heats the air, which makes it a better
conductor, which allows more current to flow, which further heats the air. With enough
electric current, the air is superheated to the point that it becomes an excellent
conductor, and all of the electrostatic potential is instantaneously released in an arc
discharge. But with less current, the discharge never graduates to arc mode, and we might
see a corona discharge, or there might be a "dark" discharge (in which there is a current,
but not sufficient to excite the air to noticeable luminosity).
The conditions that (theoretically) would produce such a sustained discharge have never been
fully described, but some have suggested that the reduced pressure inside the mesocyclone
makes it a better conductor, and this opens up a natural conduit for an electric current. In
the presence of the Earth's conductivity, excess negative charges in the cloud start flowing
through this channel toward an induced opposite charge in the Earth. The current exiting the
mesocyclone and moving toward the ground heats the air, increasing its conductivity, and
allowing the passage of more current. This channel then naturally grows until it connects
with the ground. Hence it would be the reduced electrical resistance inside the mesocyclone
that would set the stage for a weak but sustained dark or glow discharge. Otherwise, the
potentials would simply wait a little while longer, and then get discharged in lightning
strikes.
Note that if the general sense of the flow field is upward (as is the case in a
tornado), all of the factors are mutually enhancing. The low pressure in the
mesocyclone pulls air inward and upward. Existing momentum in another direction
results in a cyclonic inflow, which resolves into a vortex. The reduced pressure in
the vortex opens up a channel for the flow of an electric current. The current heats
the air, increasing its buoyancy, which makes it rise faster, further reducing the
pressure in the inflow. It also allows for the passage of more current. This
interplay of electromagnetic and thermodynamic factors is called a "discharge
vortex."
The amount of power involved in this positive feedback loop is non-trivial. The
magnetic field generated by a tornado was measured at 1.5 × 10⁻⁸ teslas from a distance of 9.6 km away using a
magnetometer.112 From this we can calculate the amps.
720 amps of steady current, for the life of the tornado, seem a bit much, and that number
has not been confirmed for any other storm. More conservative estimates of tornadic currents
have been in the range of 100~250 amps.30,112,113,114 For now, we can use the
lower of those numbers, just to show how previous researchers reached their conclusions,
while in subsequent sections, it will be demonstrated that as little as 1 amp might suffice
for an EF1 tornado. So with 100 amps of current, and guessing that the tornado was 300 m tall, and given an electric field of 5 kV/m,30,115,116 we can then calculate the watts.
150 million watts is greater than the 100 million watts that could be coming from latent
heating (as calculated in the previous section), and way more power than would necessary to
overcome 1 million watts of skin friction at the ground. Consequently, some researchers
became convinced that the tornadic energy source had been identified.
Critics of this theory have argued that tornadoes cannot possibly be
electromagnetic, because there isn't enough electric field under a supercell for
lightning, much less for the far more energetic tornado. While the electric
field responsible for lightning is well above 10 kV/m, the
electric field under a supercell is more like
5 kV/m.30,115,116 The reduced electrostatic
potential results in a distinct reduction in
lightning.117,118,119,120 This is known as the "lightning hole," and
an example is clearly visible in Figure 72, where the hole was
9 km wide (roughly the width of the supercell itself). So
there was almost no lightning under the main body of the supercell, but a ring of
lightning around the edge, and a bit more on the downwind side. And it is within the
lightning hole that the tornado appears. So tornadoes and lightning are mutually
exclusive, and therefore, tornadoes and electromagnetism are mutually exclusive.
Figure 72. Lightning hole in 2 minutes of activity shortly before the formation of an F1 tornado near Goodland, KS, 2000-06-29, courtesy New Mexico Tech. (The large pane in the lower left is the plan view.)
The discharge vortex theory responds by saying that an inverse relationship
proves that the two are indeed related, and since lightning is
electromagnetic, tornadoes have to be electromagnetic as well (otherwise
they wouldn't be mutually exclusive). And the nature of the relationship is that the
tornado is continually draining electric charges from the cloud in a dark or glow
discharge, preventing the build-up of the potential necessary for lightning. It's
certainly true that a tornado is far more energetic than a single lightning
strike, but the contention is that a tornado has all of the energy of all of the
lightning strikes in a 9 km diameter. That balances the energy
budget, and explains the lightning hole.
But the original question, concerning the concentration of energy release at the
ground in a tornado, remains unanswered. The power from ohmic heating is quite respectable,
but like latent heating, it is distributed throughout the full height of the tornado, while
the heat build-up increases with altitude. Imagine a heating element 1 m wide, 1 km tall, and with 150 million watts of power running through it.
Air near the ground is heated, so it rises. As it rises, it continues to be heated, so it
rises faster. It achieves its highest temperature (and therefore its greatest buoyancy) at
the top. This is precisely the behavior of a standard suction vortex, wherein the velocity
increases with proximity to the source of the low pressure. So the discharge vortex theory
doesn't explain the defining characteristic of a tornado, wherein the lowest pressure,
tightest radius, and fastest wind speeds are at the ground, where the friction is the
greatest.
Other EM theories have been
proposed.97,114,121,122,123,124,125,126,127,128,129,130,131 But like the
discharge vortex theory, none have answered the original question: what
concentrates the release of energy at the lower boundary?
The key to sorting this out is in the anomalies. There are several, and if we do a thorough
analysis, they will reveal the answer. Most tellingly, the electric current inside the
tornado has been estimated by several methods to be in the range of 100~250 amps,30,112,113,114 but evidence of such a current going into the ground has never been
found. 100~250 amps doesn't sound like a lot, especially when considering something as
powerful as a tornado, so the significance of this is easy to miss. But an electric current
passing through the air will find the nearest high-conductivity feature on the ground into
which to flow. It could be a lightning rod, or exposed house wiring, or a tree, or a
chain-link fence. If that feature offers more electrical resistance than a 25 mm copper cable, it will be charred or vaporized by the sustained 100+ amps. Yet of
all the strange things that tornadoes have done, this is not one of them. In 2,000 years of
tornado damage reports (including those predating bulldozers, when all of the
rubble had to be sorted by hand), there has never been a report of selective charring or
vaporization.
As both the presence of the current and the absence of evidence in the ground are
irrefutable, there is really only one possibility — the current terminates in
the air itself. In other words, the current is between two oppositely charged
regions of the atmosphere, one inside the cloud and the other near the ground, and
the low pressure inside the tornado serves as the conduit for the current. This
means that there is a charge neutralization occurring near the ground, which is an
energy conversion. As this is the only conversion that could be occurring near the
ground, it needs to be fully investigated as the possible driving force in a
tornado.
First we should identify the signs of the charges. We know that the air flowing into
the tornado is clear, so it isn't bearing any water droplets or aerosols.
Furthermore, relative humidity readings in the tornadic inflow are typically
something like 20%,132 so all of the water is fully evaporated.
Since molecular N2, O2, and H2O are not good at
hosting net negative charges, it's reasonable to assume that any noticeable space
charge would be positive. (This is confirmed by a variety of means in subsequent
sections.)
If the air flowing into the tornado is positively charged, and it's getting
neutralized by a current through the tornado, the cloud has to be negatively
charged. This is confirmed by radar (and other data). The best radar reflector in
the cloud is hail, which is also capable of the greatest negative charge densities,
while rain is the 2nd best reflector and negative charge carrier. Hence
what we see on radar corresponds roughly to negative charge densities.133,134,135 In Figure 37 we can see the dense
precipitation in the hook echo 1 km above the ground, indicating
the position of the main negative charge region. So the electric current in the
tornado is from a negative charge in the cloud to a positive charge in the air below
the cloud.
In addition to the electric field between the charges in the cloud and the air below
it, there is another field to be considered. At the ground level, the charge aloft
is positive. Due to the conductivity of the Earth, it gets an induced negative
charge, resulting in a tripole field, as in Figure 73.
Figure 73. Potential gradients (ΔΦ) with a layer of negative charge on top, positive charge in the middle, and an induced negative charge in an otherwise neutral solid conductor at the bottom. Electrostatics applet by Paul Falstad.
With time, the positive layer will evolve into a bimodal form, with an increased charge
density at the top, near the primary negative charge, and with another concentration at the
bottom, near the induced negative charge in the Earth, as in Figure 74.
As such, there are two possible stages in the development of an electric current from the
cloud into the air below the cloud. The first is from the cloud into the screening layer
just below the cloud, which might help the wall cloud get established. The second is from
the cloud all of the way down to the layer clinging to the ground, which is responsible for
the tornado.
Figure 74. Bimodal positive space charge between the cloud and the ground, with an electric current flowing through the tornado.
Given the current density, and assuming that the current is flowing into the air
itself, if we know the charge density of the air, we can calculate how much charged
air would have to be flowing into the tornado to absorb all of that current. Previous
research estimated the number of charged particles in the tornadic inflow to be one
part per billion (2.14 × 10¹⁴ charged particles/m3),
and the charge per particle to be 3.2 × 10⁻¹⁷ C.128
The numbers are realistic, but the researchers assumed that the charges would be
borne by microscopic aerosols (Ø 0.02 µm), which as noted above does not
agree with the typical relative humidity readings. If we assume that the charged
particles are all molecular ions missing only one electron, a reasonable estimate
would be one part per million.
molecules in a cubic meter of air = 1 × 10²³
one charged molecule per million = 1 × 10¹⁷ ions/m3
So this way, we get 6.25 × 10⁻³ C/m3, which agrees
with the estimate of 6.8 × 10⁻³ C/m3 from previous
research. So let's see how much air, at that charge density, it would take to absorb
100 amps of current.
With that as the volume, we can then determine the horizontal velocity of the inflow.
depth of inflow layer = 1 m
circumference of tornado 100 m wide = 314 m
cylindrical surface of vortex mouth = 314 m2
velocity of inflow = 16,000 m3/s / 314 m2 = 50.96 m/s
50.96 m/s is just barely into the EF2 range, which would seem
appropriate for an electric current at the low end of the 100~250 amp estimates.
So we have a main negative charge region in the cloud that supplies 100 amps of
current through the tornado and into 16,000 m3/s of positively charged
air clinging to an induced opposite charge in the ground. How does that account for
the behaviors of a tornado?
Let's do a thought experiment on a smaller scale. Consider standing on a steel deck,
ankle deep in a pool of positively charged air, which induces an opposite charge in
the steel, resulting in an electrostatic attraction that will hold the air down to
the deck. Let's further suppose that the charged air is warm enough that it
would rise, except for the electric force pulling it down to the deck.
Now hold a fan at arm's length, point the direction of the flow upward, and turn it
on. The low pressure below the fan will pull in air, all except for the charged air
being held down to the deck by the electric force. In other words, you won't get a
vortex that latches onto the solid boundary, like a tornado. So shut off the fan and
set it aside.
Now wheel in a DC welding machine. After setting the polarity to emit electrons,
grab the whip and point it at the deck. With the whip 1 m above
the deck, dial up something like 20 kV, which will be enough to get a slow migration
of electrons through the air, attracted to the positive charge in the air above the
deck, but not enough to get a glow discharge, much less an arc discharge. (If
anybody asks what you intend to do with only 20 kV of potential through 1 m of air, just tell them that you're doing a thought experiment and
to leave you alone.)
As the electrons pass through the air on their way to the positive charge below,
they cause resistive heating, which initiates a slight updraft, starting at the whip
itself, and extending downward. The hotter air is a slightly better conductor, so
past this point, the continued flow of electrons will prefer the existing channel,
keeping the current consolidated. When the electrons finally get to the bottom, they
neutralize the positive charge in the air. Electrostatic pressure from the
surrounding air still clinging to the deck pushes the neutral air "out of the
way," which just happens to push it upward into the resistive heating updraft.
Once the first parcel of charged air is neutralized and joins the updraft,
neighboring parcels of charged air flow inward to take its place. They pick up a
little bit of frictional heat on the way due to their proximity to the lower
boundary, but the charged air flows easily because of its low viscosity. When those
parcels of air get to the base of the updraft, their charges are neutralized, so
they join the updraft a tad more vigorously.
The slightly warmer air in the updraft will allow the electric current to flow more
easily, meaning more electrons making it to the base of the updraft, where they can
neutralize more positively charged air. The faster flow into the updraft means more
frictional heating, which increases the buoyancy of the air, which means that once
the charge is neutralized, it will rise more vigorously.
If the inflow is slightly asymmetrical, it will switch from a radial to a cyclonic
inflow pattern, instantiating a vortex. The reduced pressure inside the vortex (due
to the centrifugal force from the rotation) will further decrease the electrical
resistance of the air, resulting is a fully consolidated flow of electrons through
the vortex. The increased current density then becomes capable of neutralizing even
more positively charged air, and the vortex becomes robust.
Now reach over and grab the fan again, and hold it above the welder's whip, pointing
upward. The updraft from the resistive heating will then feed straight into the low
pressure of the fan. The fan will still be able to pull air from all around, but the
pressure at the top of the vortex will be decreased, and this drop in pressure will
be felt throughout the entire vortex, increasing the inflow and updraft speeds.
Now we can consider how all of these factors interact in a real tornado. There is an
updraft in the cloud pulling in air from all around. This will not create a vortex
with the destructive power of a tornado on the ground. But it will open up
a conduit for the flow of electricity. Ohmic heating then creates a channel of air
below the cloud that rises faster. If the air flowing into this channel has any
angular momentum, a vortex will form, which will project along the centerline of the
inflow until it hits a boundary (i.e., the surface of the Earth). The reduced
pressure inside the vortex consolidates the electric current, and the vortex becomes
more robust. With the vortex truncated at the lower boundary, the pressure equalizes
throughout the entire vortex, and the effects of the low pressure within the cloud,
plus the enhanced updraft due to ohmic heating, are felt at the ground. If this
drops the pressure enough to create condensation, the release of latent heat adds
more power. And the inflow picks up a little bit of frictional heat as it
moves along the ground, until its charge is neutralized inside the vortex and it is
free to ascend.
So we have plenty of energy sources. But we should remember that the major energy
sources (i.e., the low pressure aloft plus the ohmic and latent heating inside the
tornado) were shown in previous sections to be incapable of developing an extreme
low pressure at the ground level, as these conversions occur through the entire
height of the tornado. The force present only at the ground is the electrostatic
attraction of the charged inflow to an induced charge in the Earth, and the only
conversion only at the ground is the neutralization of that space charge, which
releases the small thermal potential developed in the inflow by frictional heating.
In what sense does that conversion account for the concentration of energy at the
base of the tornado?
The significance of the inflow clinging to the ground is that it pulls the vortex throat
right down to the ground, eliminating the "mouth regime" typical for a suction vortex. All
other factors being the same, boundary separation occurs early, before the air achieves peak
speed, and the spiraling inflow is gracefully transformed into a helical updraft, without
any sharp corners in the airflow. But if boundary separation is artificially prevented by
the electric force, the air stays on the ground, picking up additional Rankine acceleration,
and additional frictional heating. Once the electric charges in the air are neutralized, all
of the thermal potential developed by the skin friction is released. This means that in
addition to the low pressure inside the vortex (due to the low pressure aloft, as well as
the latent & ohmic heating inside the vortex), there is an extra boost in the updraft when
it is suddenly freed from its electrostatic attraction to the ground. That extra boost is
then responsible for the extreme low pressure at the mouth of the vortex, directly on the
ground.
So in a tornadic vortex, the pressure does not decrease with proximity to the source of the
low pressure. Rather, the "pipe" is sealed from top to bottom, and the pressure equalizes
throughout. The one conversion that is occurring only at the ground then results in an even
lower pressure there, where the space charge in the inflow is neutralized, and its thermal
potential is released. And thus we can now account for the distinctive characteristics of a
tornado, that the lowest pressure, tightest radius, and fastest wind speeds are at the
ground, where the friction is the greatest.
This means that the minimum conditions for a tornadic vortex are:
a liquid or solid conductor at the bottom (i.e., the Earth),
positively charged air clinging to the ground,
an abundance of negative ions aloft, and
sufficient voltage (and/or insufficient resistance) enabling an electric current.
Note that this model does not require that there be a low pressure aloft,
much less a rotating updraft. The standard model considers the tornado to be a
simple projection of the mesocyclone. But that can be disproved in many ways. First,
some of the most powerful mesocyclones on record did not produce tornadoes.98,99 Second, 20% of all tornadoes descend from thunderstorms that
aren't rotating.54 Third, if a tornado does descend from
a mesocyclone, the rotation rate does not fare evenly from the one to the other
— the tornado rotates at a rate that is independent from the rotation of the
mesocyclone. Lastly, if tornadoes were suction vortexes, their behavior at the lower
boundary would be different. These facts will always be enigmatic within the
standard model. In fluid dynamics, the distinctive characteristics of tornadic
vortexes simply shouldn't be possible. Only with the methods of EMHD can we see how
a combination of electromagnetic and thermodynamic factors can produce such a
phenomenon.
Also note that this model does have an electric current inside the tornado,
but it is not between the cloud and the ground as researchers once
believed, and which was demonstrated to be inconsistent with the evidence (and the
lack thereof). Rather, the current is between the cloud and the charged air
above the ground. The ground is only a factor because it can support an induced
opposite charge and thereby attract charged air to it, and because it introduces
friction that pre-heats the air flowing into the vortex.
To form a complete hypothesis, there is one more issue that must be addressed. If
the tornadic inflow is picking up frictional heat as it travels along the ground, it
is also gaining buoyancy. The EMHD model contends that this buoyancy is the energy
that is released at the base of the vortex when the inflow's charge is neutralized.
Prior to entering the vortex, the air is buoyant enough to rise, but it cannot, as
the positive charge in the air has induced a negative charge in the Earth, and the
electric force is offsetting the thermal buoyancy. So we need to confirm that the
electric force is more powerful than the buoyancy.
Estimates for the amount of power expended on the ground in a tornado range from 5
million watts for an EF1 to 5 billion watts for an EF5. So let's run the numbers for
an EF1. First we'll consider the force of the electric field that is pulling the air
toward the ground.
space charge = 6.25 × 10⁻³ C/m3
electric field = 5 kV/m
newtons = coulombs × electric field = 6.25 × 10−3 × 5,000 = 31.25 N/m3
Next we'll assume an inflow rate of 1,000 m3/s for an EF1, and
apply 5 MW of heat to it, and see what that does to the temperature. Raising the
temperature of 1 m3 of air by 1 °C in
1 second requires approximately 1,340 watts.
watts per m3 of air = 5 MW / 1,000 m3/s = 5,000 W·m3·s
temperature difference = 5,000 W·m3·s / 1,340 W·°C·m3·s = 3.73 °C
From the temperature difference, we can calculate the buoyancy.
mass of air at STP = 1.2 kg/m3
newtons = kilograms / 0.101971621
gravitational force at STP = 1.2 / 0.101971621 = 11.77 N/m3
standard temperature = 15.6 °C = 288.75 K
after frictional heating = 288.75 K + 3.73 = 292.48 K
temperature ratio = 288.75 / 292.48 = 0.987246991
gravitational force after heating = 11.77 N/m3 × 0.987246991 = 11.62 N/m3
buoyancy = 11.77 N/m3 − 11.62 N/m3 = 0.15 N/m3
With a downward electric force of 31.25 N/m3, and an upward buoyancy of
only 0.15 N/m3, that's 208 times more electric force than buoyancy. With
2 orders of magnitude less electric force, the air would still stay near the ground
until the electric charges are neutralized. So we'll consider 6.25 × 10⁻⁵ C/m3 to be the minimum space charge necessary to
hold the air down as it is heated by friction.
Note that this also drops the minimum neutralizing current, from 100 amps, down to 1 amp, at
least for an EF1 tornado. 1 amp of current can easily be supplied by a thunderstorm that is
only 2 km in diameter.76 (A typical lightning strike
transfers 20 coulombs, and a typical strike rate is two per minute. 20 C / 30 s = 0.66 amps
of steady current, so we know that thunderstorms can manufacture charges that fast.) A
supercell, with a diameter of 10 km, and therefore with 25 times the
volume, typically issues 25 times the lightning, or roughly one strike per second,117,118,119,120 meaning 25 amps. So we have plenty of current.
Also note that dropping the current down to 1 amp also drops the ohmic heating, from the 150
million watts estimated in the section entitled "Electric
Tornadoes?", to 1.5 million watts, making it far less significant than the 100 million
watts that was (generously) estimated for latent heating in the section entitled "Atmospheric Vortexes". Regardless, there is still plenty of
power to drive the updraft.
Taking this analysis as the working hypothesis, subsequent sections will make a
comprehensive review of the essential types of field and laboratory data available, and
develop this into a complete theory.
Central to the present hypothesis is the assertion that the tornadic inflow is
attracted to the Earth by the electric force, and can only develop vertical velocity
once its charge has been neutralized by the electric current inside the vortex.
There is, in fact, evidence of just such an attraction of the inflow to the Earth.
It's most obvious when the cyclonic inflow inscribes a pattern on the water.
Figure 75. Waterspout with banded inflow, courtesy NWS. Darker water means faster winds.
Figure 76. Waterspout with banded inflow off the Florida Keys, 1969-09-10, credit Joseph Golden, courtesy NOAA. Notice the flares indicating that the prevailing surface winds are not part of the inflow.
The cyclonic pattern makes sense, as this is what we would expect for any suction
vortex, such as a tropical cyclone (as in Figure 39). But on
closer scrutiny, there are some things about these photographs that really
don't make sense if these are just suction vortexes.
To start, we can clearly see a distinct channel of darker water that spirals inward.
Since darker water means faster winds, this reveals a channel of air that is moving
much faster than the surrounding air. In fact, the flares in Figure 76 reveal that the air outside of the channel isn't even part of
the inflow. This is definitely not what we would expect in a suction vortex.
In fluid dynamics, channeling is evidence of differences in viscosity. If all of the
air has the same viscosity, it is all subjected to the same friction. Any air moving
faster will experience more friction, so we expect a self-regulated consistency in
the inflowing speed. But if some of the air has a lower viscosity, it will
experience less friction, and therefore it will tunnel through the higher-viscosity
air. Put more mechanistically, starting from the low pressure at the mouth of the
vortex, ordinarily air would flow in from all directions, but if some of it has a
lower viscosity, that air will flow faster in response to the low pressure.
When that parcel shifts inward, the low pressure left behind it will be filled by
air from all directions, unless some of that air has a lower viscosity, in
which case the channel extends even further away. In this way, the inflow channel
can extend all of the way from the vortex to the source of the lower-viscosity air
(discussed in the section entitled "Rear Flank Downdrafts").
Normally there are only two factors responsible for the viscosity of air:
temperature and humidity. Of the two, temperature is the more significant.
Table 2. Kinematic Viscosity of Air (× 10−5 m2/s)
RH%
100
0
20 °C
1.527
1.531
30 °C
1.617
1.625
But within the relevant ranges of temperature and humidity, we only get a 6%
difference in viscosity, and we're seeing much more than a 6% difference in
velocity. This rules out a fluid dynamics explanation, so the only possibility is
that this is one of the effects of the electric force. And in fact, if the air is
charged, electrostatic repulsion within the air will prevent the particle collisions
that instantiate friction, thereby reducing the viscosity.25,26,27 At the macroscopic level, electrostatic repulsion discourages the low and high
pressures inherent in turbulent flows, thereby encouraging the flow to remain
laminar well above the threshold for turbulence, with the effect of increasing the
speed of the flow.
Far more significantly, this electrostatic reduction in viscosity also explains why
charged air, attracted to an induced opposite charge at the surface of the Earth,
can flow into the vortex faster than neutral air just above it. In other words, in
top view we see a discrete inflow channel that can only be explained as charged air
tunneling through neutral air, and in elevation view we see the lowest layer of air
skidding along the surface to get into the vortex (as represented schematically in
Figure 71), which again can only be explained as charged air
tunneling through neutral air. The difference is that the elevation view is a lot
harder to explain. A relatively small difference in viscosity can result in a jet of
air channeling through other air, but at a boundary, skin friction
increases with the square of the velocity, meaning that the viscosity difference has
to be enormous for the boundary layer to flow faster.
Figure 77. Normal versus tornadic boundary layers.
To highlight the point, it's instructive to note that fluid dynamics does
have a way of getting a fluid to move faster at a boundary, but only if there are
actually two fluids present, where the fluid with the lower viscosity is in contact
with the boundary, as in Figure 78. Even though the friction is
greater at the lower boundary, the milk will flow faster than the honey due to its
lower viscosity, and the milk will channel through the honey to satisfy the low
pressure.
Figure 78. Suction vortex in two fluids.
Two-fluid simulations are sometimes used to study tornadic vortexes, as they have a
couple of properties in common with tornadoes, and that are impossible to get
otherwise.136 First, the vortex only pulls in more fluid at the
lower boundary, and second, the inflow travels along the lower boundary, even if it
has to travel a long way. The reason why two-fluid simulations aren't considered to
be realistic is that it shouldn't be possible to develop such substantial viscosity
differences in the air. As there is no doubt that tornadoes exhibit two-fluid
behaviors, and as temperature and humidity combined cannot account for the
difference in viscosity, the only possibility is that the "lower fluid" is a layer
of charged air.
Back to the cyclonic pattern in Figures 75 and 76, the
EMHD model states that the space charge inside the inflow channel has to be at least
6.25 × 10⁻⁵ C/m3 if it is to overpower the buoyancy
generated by frictional heating. Previous research has found a correlation
between electric fields and the speed of the tornadic inflow,30 suggesting that they detected an inflow channel. But the increase in electric field
was attributed to triboelectric charging in the particulate matter that was creeping
or saltating along the ground. The particulate matter itself was not studied —
it was merely assumed that any difference in electric field that was directly
proportional to air speed had to be due to static electricity, because until now, no
one has proposed that the air itself is charged. It will take a space charge study
to resolve the issue.
Also note that while conventional modeling of a tornado uses the Rankine formulas,137,138 which assume that the flow field is axisymmetric, the channels in Figures
75 and 76 are certainly not. The significance is that in a
discrete inflow channel, the velocity does not decrease with distance from the vortex
— it is the same, from the source of the channel to the vortex wall. This means that
velocities outside of the vortex are underestimated by Rankine assumptions, and the
difference might account for at least some of the unexplained destructive power of
tornadoes outside of the vortex wall.
While 6.25 × 10⁻⁵ C/m3 is only a moderate space
charge by electrostatic standards, and is less than the charge produced by household
ionizing air purifiers, it is nevertheless far above the normal atmospheric charge
density. This means that something had to produce it, and a complete theory has to
identify the source of this charged air.
The EMHD model of the mesocyclone offers the first possibility, that there is a
positive double-layer paralleling the main negative charge stream. If the
mesocyclone descends, this double-layer is squashed against the ground, forming the
forward flank downdraft (FFD).
Figure 79. Relationship of forward flank downdraft to precipitation core.
If the FFD is positively charged, it makes sense that it is a vigorous downdraft,
and yet it typically only yields light precipitation, while the main rain area is
between the FFD and the mesocyclone, where the downdraft is weaker. (See Figure
80.) All other factors being the same, we'd expect the fastest
downdrafts to bear the most precipitation, because of precipitation loading (i.e.,
the additional gravitational force from the rain or hail), and because of the
availability of liquid water to sustain evaporative cooling as the air descends. So
the main rain area should have the fastest downdraft, and the FFD should be weaker.
Since it's actually the other way around, we have an anomaly to explain, and the
likeliest explanation is that the FFD is positively charged. As the air descends,
evaporation reduces the size of a solid or liquid water particle. If it is charged,
the charge density increases. If it hits the Rayleigh limit, the particle will break
apart due to electrostatic repulsion.139 Hence a positive charge encourages
evaporation, and a positively charged downdraft is subject to more evaporative
cooling than a neutral or negative downdraft, and this makes it fall faster.
Once the FFD hits the ground, the outflow expands in all directions, and there is evidence
of charged air flowing from the FFD all of the way back to the mesocyclone, against
the prevailing surface-level winds. So the FFD does make a contribution to the
tornadic inflow.
But recent research suggests that the larger body of air flowing into the tornado
comes from the rear flank downdraft (RFD), so we'll focus on this instead, and see
if we can develop a reasonable estimate of its charge density.
The RFD is a sustained dry downdraft, outside the cloud, on the upwind side of the
storm.132,140 Its presence in tornadic storms is so consistent that
it is considered to be a causal factor in tornadogenesis, though "causal" is a loose
term in this context, since no one can explain why a downdraft, upwind of the
mesocyclone, would encourage tornadogenesis. This air invariably gets drawn into the
mesocyclone,35,141,142,143,144 and though there are "cold RFDs" and
"warm RFDs," they are generally a couple of degrees (Celsius) cooler than the
surface-level air. So they should reduce the force of the mesocyclone, and
that would tend to discourage tornadogenesis.
Figure 80. Plan view of supercell, courtesy NWS, redrawn by Vanessa Ezekowitz.
Furthermore, thermodynamics can't even explain what causes the RFD itself.
If it was a wet downdraft, then it would be cold, dense air falling because of
evaporative cooling, the way normal downdrafts are created. But this does not appear
to be the case. There is certainly a downdraft caused by precipitation falling out
of the back-sheared anvil, but because of wind shear, this air shouldn't fall
straight to the ground. Rather, it should get blown around the updraft, and hit the
ground between the mesocyclone and the forward flank downdraft. This has led
researchers to believe that the RFD has to originate from a lower altitude in order
to hit the ground upwind of the storm. Below the anvil, the closest that we could
come to a wet downdraft, upwind of the storm, would be if shearing dry air mixed
with precipitation-bearing air in the cloud itself, causing the precipitation to
evaporate, and creating a downdraft. This is theoretically possible, but a downdraft
falling at 50 m/s, when it began its descent only a couple of kilometers above the surface, would only be possible if
the air had become completely saturated with water vapor, creating far colder and
denser air than has been observed. Actual RFD relative humidity readings are more
like 20%, with temperatures near those of the surface-level air.132 Such air simply has no right to be a downdraft.
Some of the literature suggests that the RFD is a result of high pressure on the
upwind side of the storm, where shearing mid-level winds collide with the updraft.
But the lateral motion at the relevant altitudes is roughly 20 m/s, while the RFD falls at roughly 50 m/s. Even if the
cloud was an impenetrable boundary of that shape, it would not create deflected
speeds faster than the approaching speeds. And clouds are certainly not impenetrable
boundaries in the thermodynamic model. Besides, if shearing mid-level winds collide
with an updraft, there will be a high pressure. But there will be two net
effects: the updraft will get tilted in the direction of the mid-level winds, and
the mid-level winds will get deflected in the direction of the updraft. In other
words, the result will be the vector product of the two motions. This will not
create a downdraft — it will create entrainment into the updraft.
Mechanistically speaking, the RFD is hard to explain, and it has proved difficult to
simulate with thermodynamic modeling.132 This means that other
forces are present.
Positively charged precipitation falling out of the back-sheared anvil will indeed
initiate a downdraft, which itself will be positively charged. Due to wind shear, we
would expect this downdraft to wrap around the storm, and merge with the forward
flank downdraft. But if it is positively charged, it will be repelled from the
massive positive charge in the main body of the anvil, and it will be attracted to
the negative charge induced in the Earth by it. This gives it the force necessary to
ignore the shearing mid-level winds, and to fall straight to the ground. (As
outlandish as this might seem, evidence of the jet stream getting forced all of the
way to the ground was collected during a tornado in Leamington, Ontario on June 6,
2010.145)
Figure 81. Hypothesized origin of the rear flank downdraft.
The ultimate speed of the RFD is obviously not a simple function of evaporative
cooling, since it isn't substantially cooler than the surrounding air. Only the EMHD
model identifies ample energy sources, in the correct form, to account for a 50 m/s downdraft upwind of the storm. A 50 m/s upper-level jet gets deflected down by evaporative cooling from virga falling out of
the back-sheared anvil. The downdraft is also accelerated down by electrostatic
repulsion from the anvil, and it is pulled down by its attraction to an induced
opposite charge in the ground. And though the RFD hits the ground with a lot of
force, it hits only 1 km from the main updraft in the storm, so
the low pressure at the base of the mesocyclone absorbs the high pressure. Hence the
RFD has pushes and pulls all of the way through its trek, from its origin as an
upper-level jet to its entrainment into the mesocyclone.
Note that the furl in the "back-sheared" anvil is commonly considered to be the
result of the "collision" between the jet stream and the expanding anvil. Actually,
there's no collision. Evaporative cooling under the anvil does all of the work in
deflecting the jet stream downward, and the anvil is actually being sucked into the
void left by the diverted jet.
So if the evaporative cooling is that powerful, why isn't the RFD as cold
as a normal downdraft (at least 10 °C below ambient)? The
reason is that the RFD only gets one dose of hydrometeors, which completely
evaporate within the first couple of kilometers below the
anvil. This is the source of the 20% RH readings in the RFD. This also accounts for
temperatures near those of the surface air. Jet stream air, if mechanically forced
down to the ground, would actually be far warmer than the surface air, due
to the compression. So some evaporative cooling is occurring. But for the
RFD to be a wet downdraft hitting the ground, with 100% RH at 10 °C or more below ambient, there would have to be an over-abundance of
hydrometeors that could sustain the evaporative cooling all of the way down. As the
downdraft falls, the ambient pressure increases, which raises the temperature,
creating the gap between the temperature and the dew point into which the excess
hydrometeors can evaporate. If sufficient liquid/solid water is present, evaporative
cooling continues. Otherwise, a 100% RH under the anvil results in 20% RH at the
ground, with temperatures at or near ambient.
Is the RFD capable of supplying air with a minimum space charge of 6.25 × 10⁻⁵ C/m3, as estimated in the section entitled "A New Hypothesis"?
If the tornadic inflow comes from the RFD, which originates as an upper-level
jet stream, we should start our assessment with the upper-level jet. This is already
positively charged, as positive charge increases with altitude, but this charge is
not significant for our purposes. In the fair weather conditions upwind of an
isolated thunderstorm, the upper-level jet only has 1 × 10¹⁰ ions/m3 (producing 6.25 × 10⁻¹⁰ C/m3),93,146 which is 5 orders of magnitude shy.
The next source of charge will be virga falling out of the back-sheared anvil.
Typical charge densities in the cloud inferred from electric field measurements are
≤ 1 × 10⁻⁹ C/m3,21,147 so we might
guess that this is the charge of the downdraft under the back-sheared anvil. But
this is still 4 orders of magnitude less than the minimum of 6.25 × 10⁻⁵ C/m3 at the ground level.
If the positively charged anvil of one thunderstorm is overhanging the updraft of
another thunderstorm, the upper-level inflow will be pre-charged.63 But even if we double the charge density in the anvil, and add that to the fair
weather charge of the upper-level jet, we still only have 2.625 × 10⁻⁹ C/m3, which is
still 4 orders of magnitude too little.
Between the back-sheared anvil and the ground, we can expect the charge density of
the RFD to increase. The parcels of air that absorb the most virga will undergo the
most evaporative cooling, so they will fall the fastest. Because the virga is
charged, the fastest-falling parcels will also have the highest charge density. The
charges themselves will accelerate the descent, as repulsion from the anvil and
attraction to the induced opposite charge in the ground will motivate the flow.
Also, the greater charge density will reduce the viscosity and prevent the
transition to a turbulent flow,25,26,27 further increasing the
velocity. In Figure 75 we're seeing roughly an order of
magnitude of speed increase that can only be attributed to the turbulence threshold being
raised by the space charge. So we can guess that all of the factors in this paragraph
added together will increase the charge density in the RFD by an order of magnitude,
meaning that the discrepancy is now 3 orders of magnitude, not 4.
At the ground, the RFD expands outward into the flow field of the tornado. Here
again we can expect a 10x increase in speed due to the reduction in viscosity and in
turbulence due to electric charges (as in Figure 75), so
nominally (and perhaps generously), the discrepancy comes down to 2 orders of
magnitude.
And there is one more factor that needs to be considered. Where the RFD hits the
ground, there is a turbulent flow in the presence of an electric field. Since the
forces that determine which way a parcel of air will go in a turbulent environment
are subtle, any other force present will have a dramatic effect. Hence we can expect
the electric force to sort the parcels on the basis of charge, resulting in a far
greater charge density near the ground.
How much greater? We wouldn't attempt a numeric answer to such a question, as
turbulent flows are tough to predict — only field studies return reliable
descriptions of such behaviors. Unfortunately for the present research, no one thus
far has seen the justification to attempt the logistical difficulties (and the
dangers) of getting space charge data from inside the tornadic inflow, because no
one previously assigned any significance to them. This leaves a conspicuous void in
the middle of the calculations. We know that the tornadic inflow sticks to the
ground, despite the friction and the buoyancy that results from it, proving that
another force is present. In the atmosphere, that "other force" can only be the
electric force. We know that there is an electric current inside the tornado, and
that it isn't going into the ground, so it has to be terminating in the air itself.
This would only be possible if the air itself is charged. The current density and
the volume of the inflow match, assuming a 1 part per million space charge. Two
orders of magnitude less space charge would be sufficient to overpower the buoyancy
created by frictional heating, accounting for the distinctive adherence of the
tornadic inflow to the ground. So all of the pieces are fitting together, and the
only one that's missing is the direct measurement to confirm that particle sorting
due to turbulence between the RFD core and the tornado increases the charge density
near the ground by 2 orders of magnitude.
Future research will, of course, answer all of the questions. In the meantime, the
only way to proceed is to see if we can marshal the rest of the anomalies in the
problem domain with an assumption that the proposed charge densities are present. In
other words, we can check this hypothesis against all of the available
data, even if we cannot check it against all of the possible data. If full
consistency with existing data can be demonstrated within a plausible hypothesis, it
will be time to seek the make/break field data that have not been collected yet.
So the EMHD model asserts that if the jet stream gets forced to the ground, hitting
only 1 km from the powerful updraft inside a mesocyclone, the
air will be drawn inward, but instead of curving upward as it goes, it will cling to
the ground because of an induced electrostatic potential, of sufficient force to
keep the air flowing along the ground, even as frictional heat increases the
buoyancy well beyond the threshold for an updraft. Once inside the tornado, an
electric current neutralizes the charges keeping the air down, thereby releasing the
thermal potential in the air, resulting in a vigorous updraft. The updraft provides
an outlet for the air flowing along the ground, enabling a continuous flow, from the
high pressure at the base of the RFD, to the low pressure at the base of the
tornado. The difference between the lines of motion predicted by fluid dynamics and
the actual path followed along the ground constitutes the potential energy that is
released at the base of the vortex.
Figure 82. Tornadic potential energy.
Lastly, we should consider the implications of these contentions for short-term
tornado forecasting. If the RFD is a key ingredient in tornadogenesis, and if it is
virga falling out of the anvil that initiates the RFD, then the jet stream and the
back-sheared anvil deserve closer attention in estimating the probability of
tornadogenesis. In these terms, it makes sense that the more severe the
thunderstorm, the greater the chance of a tornado — only an extremely powerful
updraft will be capable of setting up the back-sheared anvil that can then initiate
the RFD. But it will also take powerful upper-level winds to tilt the storm such
that the FFD doesn't undercut the updraft. Such might be the rare combination of
extreme-range factors that enable these catastrophes. The significance here is that
the back-sheared anvil is an easy feature to detect, visually as well as with radar,
and from a great distance away. The RFD, being a dry downdraft, is invisible by both
of those methods.
At this point, the core of the EMHD model of mesocyclones and tornadoes, and of the
positively charged tornadic inflow that comes from outside the mesocyclone, is
essentially complete. We shall now apply this model to the broadest possible range of
tornadic phenomena, to see how the model stands up. The first test is to see if we
can at last explain, in mechanistic terms, the classic form of the tornado, with the
tightest radius at the base, which then expands in the direction of the flow.
Figure 83. Tornado in Union City, OK, 1973-05-24, courtesy NOAA Photo Library.
Figure 84. Wedge tornado (1 km wide at base) in Jordan, IA, 1976-06-13, courtesy Iowa State University.
In fluid dynamics, a "condensation funnel" is a well-understood phenomenon. The lines of
motion in a standard suction vortex converge as they approach the source of the low
pressure. (See Figures 60~64.) Away from the source, the low
pressure relaxes. This means that lines of equal pressure inside the vortex slowly taper to
a point away from the source of the low pressure. At any given relative humidity, one of
these lines represents the pressure at which water molecules condense. At a large enough
scale, the condensation will be visible, and the vortex will appear to expand in the
direction of the flow, even as the lines of motion converge.
For meteorologists, thinking of the tornado as a condensation funnel inside a mesocyclonic
vortex seems to be an adequate description. But this is fundamentally incorrect.
First, the mesocyclone and the tornado are actually two different flow fields, with
stationary air in-between. (See Figure 71.) Only in the most extreme
cases does the mesocyclonic flow field extend all of the way to the ground, but even then,
there are distinct differences between the larger, slower mesocyclonic inflow and the
smaller but faster tornadic inflow. (These details are discussed in the section entitled
"Eccentric Sub-vortexes".) For the tornado to actually be the core of the
mesocyclonic vortex, air speeds would have to start at 0 at the center, increase linearly to
the maximum in the wall of the mesocyclone, and then decrease hyperbolically outside the
wall. Yet the tornado rotates faster than the surrounding mesocyclonic inflow, meaning that
it has to be a different vortex.
More problematic is that the lowest pressure is actually at the ground, and the low pressure
relaxes in the direction of the flow.102,103,148,149 This means
that the taper in the lines of equal pressure points upward. (See Figure 85.) In no sense does the visible aspect of the tornado reveal the isobars in the
mesocyclonic flow field.
The visible aspect of the tornado actually reveals simply the lines of motion, and these
expand in the direction of the flow because the low pressure is relaxing (meaning less
centripetal force). There is also sometimes a distinct flare at the top of the tornado where
it merges with the mesocyclone, indicating that there is yet another change in the balance
of centripetal and centrifugal forces in the tornado. (See Figure 86.)
In this case, it is a reduction in the centripetal force supplied from outside the tornado,
as a consequence of the decreasing pressure in the mesocyclonic flow field, that further
increases the radius of the tornado.
Figure 86. Tornado near Bandar Lengeh, Iran, 2008-11-23, courtesy YouTube.
The base of a tornado is not always visible, and damaging or even deadly winds can
occur when there is no other indication that a tornado is present at the ground
level.150 The lack of condensation in the presence of an extreme
low pressure is, of course, not what we would expect. There wouldn't be a
thunderstorm if it were not for the moist air in the lower troposphere. And
if there is a humidity gradient, we would expect the most humid air to be closest to
the surface of the Earth, since it will be the coolest (and therefore the densest)
air in the gradient. Especially in vortexes over the ocean, we would expect the
humidity at the surface to be near 100%. Since tornadoes only pull in air from the
surface, and since the pressure inside a tornado is lower than that inside a
tropical cyclone,102,103,148,149 there should be no way that a
tornado could form without causing condensation at the surface. Yet tornadoes
without condensation at the surface are common, especially over the ocean.
(See Figures 87~89.)
Figure 87. Tornado in Lombok, Indonesia, 2007-12-29, courtesy Fadil Basymeleh.
Figure 88. Waterspout near Oran, Algeria, 2007-10-30, courtesy Nassimatique.
Figure 89. Waterspout off the coast of Brach, Croatia, 2006-08-04, courtesy D. J. Malden.
The standard model explains that such tornadoes are being fed by warm, dry
air (such as from the RFD) that will not yield condensation even in the extreme low
pressure at the base of the tornado.132,140 The EMHD model agrees,
and goes on to say that the air is also positively charged. The positive charge
reduces the chance of condensation, because the electrons necessary for covalent
bonding are not present. Also, the water molecules might be so highly
charged that the electrostatic repulsion between them is further discouraging
condensation.22
But both models then have an even tougher question to answer. How does
condensation form as the air ascends? Tornadoes only pull in air at the surface,151 so this is not evidence of a new source of moisture. The
fastest wind speeds are nearest the surface,152,153,154,155 so there isn't any increase in tangential velocity that could drop the pressure and cause
condensation. The lowest pressure in a tornado is at the surface,102,103,148,149 and from there the low pressure relaxes. If there isn't
any condensation in the extreme low pressure at the surface, there shouldn't be any
condensation anywhere in the tornado.
Only the EMHD model can explain this. If the tornadic inflow is positively charged,
its water vapor will not condense until the charge is neutralized. There is
certainly no absence of negative charge inside the cloud, and there is well-known
direct evidence of an electric current inside tornadoes, which has been estimated at
100~250 amps.30,112,113,114 The electrons in such a current will
eliminate the electrostatic repulsion between positively charged water molecules,
and make covalent bonding possible. This enables the condensation of the water vapor
even as the low pressure relaxes.
We should also observe that the "condensation funnels" are not tapering to a point. In fact,
there isn't any condensation in the core of the vortexes — the condensation is all in
the vortex wall. This is yet another indication that the standard fluid dynamic framework is
unprepared to deliver an accurate description of these vortexes. The most likely cause for
condensation in the vortex wall, and not in the core, is that the source of the neutralizing
electrons is the negatively charged precipitation in the hook echo, which forms a sheath
around the updraft. So the neutralization begins in a cylindrical form at the
mesocyclone/tornado interface. From there, the electrons are attracted to the positive
charge clinging to the lower boundary, which is by no means only within the vortex. Hence
the electrons flow through the conductivity in the water vapor that has already condensed in
the upper vortex wall to the truncation point, and then they flow straight down from there,
never converging on the centerline.
In the preparation of this paper, two cases were found in which condensation
occurred only at the surface, but these appear to be exceptions that prove
the rule. First, see Figure 90. A dust sheath forms on the
ground, and the video briefly pans upward to show the rope-like condensation funnel
coming down from the cloud. But the rotation at the surface doesn't last long, and
the dust sheath starts to fall apart. Look closely at the very end of the video
— a bunch of condensation forms at the surface. Ordinarily, more condensation
means lower pressure, and this would tend to indicate that the vortex is
strengthening, but this vortex is at the end of its cycle. It's possible that the
vortex ran out of charged air, resulting in more condensation and the
dissipation of the vortex.
Figure 90. Condensation forming as the dust sheath falls apart, courtesy Jim Reed and Katie Bay. Click the image to watch the associated video.
Figure 91 shows another example. In this case, there was no dust sheath,
and at the time of the screen grab, there was condensation at the surface that lasted for
several seconds. The fact that the condensation evaporated as the air ascended proves that
the pressure was increasing, in the direction of the flow. So there was definitely
a secondary low pressure at the surface, more powerful than the low pressure aloft (but
smaller in volume). And as with the previous case, the presence of condensation would tend
to indicate that the tornado was strengthening, but this occurred only in the last couple of
seconds before the tornado disbanded altogether.
Figure 91. Tornado in Brooklyn Park, MN, 1986-07-18, courtesy KARE-11 Television. Click the image to watch the associated video.
So in the EMHD model, tornadoes are not low-pressure condensation funnels at all,
but rather, low-pressure electrically neutralized condensation funnels. By fluid
dynamic standards, we would expect condensation at the surface, if there is an
extreme low pressure. But that expectation would only be legitimate if an extreme
low pressure at the surface made sense in a purely fluid dynamic context, which it
does not. Another force had to create the conditions necessary for a
tornado. While that force is present, an absence of condensation in an extreme low
pressure is possible. When that force expires, we revert to just fluid dynamics, and
both the brief condensation at the surface and the immediate failure of
tornado make sense.
Tornadoes that have yet to touch down sometimes have filaments of condensation
pointing downward. (See Figure 92.) These are typically
considered to be small sub-vortexes,156 but there is no evidence of
any rotation within these filaments. If we take a close look at the video associated
with Figure 93, we can see such filaments in motion, and a fluid
dynamic explanation is unconvincing. As the tornado begins to touch down, a couple
of filaments shoot down to the ground at an extremely rapid rate. An instantaneous
drop in pressure that could cause such condensation, within such a narrowly defined
channel, in the open air, is hard to believe. We can also see a streamer of
condensation emerging from the ground shortly before the tornado touches down, and
again, there is no evidence of rotation, so this is not a streamwise vortex at the
boundary between static air outside the tornado and rotating air inside it.
Figure 92. Filamented tornado near La Grange, WY, 2009-06-05, courtesy VORTEX2.
Figure 93. Streamers of condensation emerging from the surface in Krasnozavodsk, Russia, 2009-06-03, courtesy English Russia. The tornado went on to do EF3 damage. Click the image to watch the associated video.
The more plausible explanation is that these filaments are evidence of electron
streams shooting down from the cloud (or rarely, up from the ground, as in Figure
93). As such, the speed with which they can move, and the
visible effect that they have, become easy to understand. The water vapor in
positively charged air subjected to an extreme low pressure will condense
instantaneously if the necessary electrons become available, so the only limiting
factor is the speed at which an electron avalanche can move, which isn't much of a
limitation. More problematic for fluid dynamics is the filamentary nature of the
condensation, but this is an expected property for an electric current, and for two
reasons. First, electron streams are subject to the magnetic pinch effect, which
consolidates them into filaments (as they are in lightning). Second, condensed water
molecules are much more conductive than nitrogen and oxygen molecules. So once
condensation forms, the current will flow through that condensation to get to the
next parcel, producing the characteristic "frayed cotton ball" effect, which is not
reproducible with fluid dynamics alone.
There have been many reports of unusual colors in tornadoes.
First, we can take another look at Figure 88, and notice the
peculiar orange color of the vortex. This is an unusual color for condensation,
which is typically white (or gray if it's in the shade). Occasionally the clear slot
in the cloud allows the tornado to become sunlit, and we get a better look at the
actual color, which is not always white. If a tornado has a reddish tint, this is
typically attributed (correctly) to the presence of ferric oxide in the red clay
dust kicked up by the tornado. But this tornado over the water isn't kicking up any
red clay dust. Since hydrogen, nitrogen, and oxygen have emission lines in the
orange~red bands, the most plausible explanation is that positive ions are getting
bombarded by electrons in this region.
Second, there have been a variety of reports of tornadoes glowing in the dark, like
neon lights.105,157,158,159 Blue and orange are the colors that have
been reported. Since a corona discharge in the presence of ionized nitrogen and
oxygen produces such colors, the most likely explanation for this luminosity is that
an electron stream is bombarding air molecules inside the tornado.
Figure 94. Two luminous tornadoes that did F4 damage in Toledo, OH, 1965-04-11, courtesy James R. Weyer.
Corona discharges in air normally require electrostatic potentials in excess of 100
kV/m.160 So how does a corona discharge occur in the 5 kV/m of
potential below a supercell? The answer is that the threshold for a corona discharge
is a function of the resistance of the air, and this varies with pressure.
Lower-pressure air is a better conductor, and therefore will support a corona
discharge in a weaker electric field. Hence the pressure drop within a tornado makes
corona discharges possible with 5 kV/m of potential.28,110
Third, eyewitnesses inside powerful tornadoes (who were lucky enough to survive) have
reported seeing "fingers" or "rings" of continuous arc discharges at the top of the
tornado.161,162,163 From the outside, there have been reports of continuous
ring lightning at the top of the tornado.31,105,122,164 Such reports are
extremely rare, and because of this, thermodynamicists have dismissed the possibility of a
causal role for electromagnetism in tornadogenesis.165 Such dismissals are
based on the assumption that heat from lightning is the only way that electromagnetism could
influence a thermal system. But in the EMHD model, ohmic heating from the current flowing
from the cloud down to near the ground isn't terribly significant, so the dismissal doesn't
apply to this model. Still, there have been enough credible reports that the phenomena are
to be considered real, and any comprehensive explanation of tornadoes has to demonstrate
plausible conditions, even if the model doesn't consider them to be prime movers.
If there is a flow of electrons down through the tornado, sufficient in some cases
to generate a glow discharge, it's also theoretically possible that the discharge
could be robust enough to graduate into a sustained small-scale arc discharge. This
would be fundamentally different from lightning, which is a rapid release of
potentials on a large scale. In contrast, arc discharges at the tornado/mesocyclone
interface would be small but continuous, as negative charges drawn into the
mesocyclone interact with a steady stream of positive charges in the tornado.
One of the curious things about tornadoes is that the inflow in laminar, and the base of the
tornado is laminar, but the vortex sometimes converts to a turbulent flow before
entering the mesocyclone. This is anomalous because if the source of energy is the low
pressure in the mesocyclone, we would expect a laminar flow all of the way into the
mesocyclone. Turbulent flows only occur when air is decelerating, while air responding to a
low pressure always accelerates toward the source of the low pressure. This is
clear evidence of an extreme low pressure at the ground, and that the low pressure
relaxes in the direction of the flow.
Figure 95. Laminar-to-turbulent flow conversion in a tornado in southeast Colorado, credit Linda Lusk, courtesy NCAR.
Figure 96. Tornado with turbulent flow beginning just above the surface near Watkins, CO, courtesy NCAR.
Figure 97. Tornado shrouded by turbulence in Great Bend, KS, 1974-08-30, courtesy Bob Dundas.
Such vortexes are actually fairly easy to create in the laboratory, using an
apparatus similar to that depicted in Figure 98.166,167,168,169,170,171,172,173 The fan at the top motivates the airflow,
analogous to a mesocyclone. At the base of the apparatus, there is a chamber with a
hole in it. Inside the chamber, louvers impart angular momentum into the air,
creating the vortex. A kerosene boiler adds vapor that condenses in the extreme low
pressure going through the hole, and this makes the vortex visible. Glass panels
(not shown) seal the central chamber, such that all of the air that is to satisfy
the vacuum created by the fan has to pass through the small hole in the lower
chamber.
Figure 98. Bottleneck vortex apparatus.
Figures 99 and 100 show the results, using
different "swirl ratios" (i.e., the tangential velocity divided by the vertical
velocity).
Figure 99. Laboratory demonstration of laminar and turbulent vortexes, courtesy C. R. Church.
Figure 100. Close-up of vortex breakdown, courtesy C. R. Church.
In the 1st panel of Figure 99, a small amount of
angular momentum at the base creates a perfectly straight, laminar vortex. Note that
this vortex should expand in the direction of the flow, as in Figure
85, but it does not, because of a simple difference. In
Figure 85 we see that the mesocyclone is pulling air from
all around, and then there is also the tornado pulling in air at the surface. As the
tornado approaches the mesocyclone, the pressure outside the tornado drops, thereby
reducing the centripetal force, which results in an expanding radius. But this
apparatus is only pulling air from the bottom, so there is only one pressure
gradient entirely within the vortex, and none of the effects of one gradient merging
with another.
In the 2nd panel of Figure 99 (and also in Figure
100), with a larger swirl ratio, we see a phenomenon known as
"vortex breakdown." With a high degree of angular momentum imparted into the vortex
by the louvers in the base of the apparatus, the air that emerges is rotating faster
than the surrounding air, and is therefore subject to friction that will slow it
down. As it slows down, the laminar flow becomes prone to turbulence. The turbulence
then allows the surrounding air, not subject to any centripetal force (because it is
not rotating) to flow downward into the vortex, seeking the extreme low pressure at
the base. A "downdraft" inside the vortex relieves the low pressure, and thereby
reduces the centripetal force. This results in the rapid widening of the vortex just
prior to its breakdown. Note that even in tightly controlled conditions, this
configuration is extremely unstable. So it is no surprise that tornadoes like this
(such as in Figure 95) are rare.
In the 3rd panel, with an even higher swirl ratio, the vortex breakdown
occurs as soon as the air exits the hole (similar to Figure
96). And in the 4th panel, the turbulence is so
robust that it shrouds the vortex (similar to Figure 97).
Hence the conversion from a laminar to a turbulent flow, in the direction of the
flow, is very definitely possible, if there is an even lower pressure that occurs
first. In the more general sense, an extreme low pressure, away from the source of the low
pressure, is an apparent violation of the 2nd law of thermodynamics, unless there
is a bottleneck upstream of the energy source. Then all of the rules change, and a vortex
that expands (or even breaks down) in the direction of the flow goes from being impossible
to being the only result that is possible. Meteorologists might not be familiar
with the properties of bottleneck vortexes, because they only occur upstream of energy
sources in closed systems, and the atmosphere is normally considered to be an open system.
But bottleneck vortexes have been well-studied in a variety of engineering disciplines,
where energy transport is typically accomplished in closed systems. For example, combustion
within the cylinder of an automobile engine relies on the thorough mixture of fuel and air,
which is accomplished with turbulent airflows within the cylinder. This turbulence is
deliberately caused by drawing air through a very narrow gap (~0.16 mm)
between the valve and the valve seat. So while the energy source during the intake stroke is
the receding piston, the lowest pressure is not at the surface of the piston — it's
just past the valve gap. This isn't a violation of the Second Law — it's just the
expected properties of a bottleneck in a closed system.
The sections entitled "Lab Suction Vortexes" and "Atmospheric Vortexes" demonstrated that tornadoes defy the
principles of typical (open-air) suction vortexes. Now we see that tornadoes have precisely
the properties of bottleneck vortexes. This can only mean that tornadoes are behaving as
closed systems, in which there is a bottleneck in the airflow, creating a build-up of energy
that is released at the base when the air finally gets past the friction at the ground.
Making sense of this, in terms of open-system thermodynamics, just isn't going to work,
since none of the behaviors of open flows are present, and all of the behaviors that
are present are only treated by closed-system thermodynamics. So we have no choice
but to acknowledge that there has to be some sort of bottleneck in the flow. But what could
cause a "bottleneck" in the atmosphere?
There is really only one possibility here, because there is only one other force present:
electromagnetism. Since air is not responsive to the magnetic force, only the electric force
could be powerful enough to accomplish such a feat in the atmosphere. If the tornadic inflow
is electrically charged, and is therefore experiencing an electrostatic attraction to an
induced charge in the Earth, it will be subjected to much more skin friction, and it will
not detach from the boundary when expected. This means much more frictional heating, and
much more Rankine acceleration. When the charge is neutralized by an electric current inside
the tornado, the air is released from its attraction to the ground. The net effect will be
the same as if there was a big piece of plywood with a hole in it.
More recent attempts at generating tornadic vortexes in the laboratory use a
different apparatus.174,175,176,177 Instead of the lower chamber with a
hole in it, the plenum of the fan feeds down around the outside of the apparatus, as
shown in Figure 101.
Relevant results were achieved with the flow rate at 59 m3/s, and with
the outer casing brought to within 0.1 m of the base of the
apparatus. This research confirms that a tornadic vortex is not possible unless
there is a force capable of restricting the inflow to the surface. That force could
be a piece of plywood, a metal shroud, or an electric charge. Outside of the
laboratory, it can only be an electric charge.
A debris cloud is a funnel of dust and dirt that sometimes gets stirred up at the
base of the tornado, and is then accelerated upward and outward from the tornado,
outside of the vortex. It moves rapidly at first, and then the speed decreases until
the debris achieves some sort of equilibrium, hovering 100 m or so above the ground, and rotating slowly around the tornado. The total mass of
the debris cloud can reach tens of thousands of tons.178 (See
Figures 68,
102, and 103 for examples.)
The persistence of debris clouds outside the vortexes clearly demonstrates that
tornadoes only pull in air at the ground, in spite of the skin friction, thereby
defying the principles of fluid dynamics. This is yet another proof that
something is binding the inflow to the ground. This can only be evidence
of an electrostatic attraction between the inflow and the surface of the Earth.
Figure 102. Tornado that did F5 damage in Elie, Manitoba, 2007-06-22, courtesy Justin Hobson.
Figure 103. Tornado that did F4 damage in Manchester, SD, 2003-06-24, courtesy Matt Grzych.
The interesting thing about the debris cloud is that it proves that in addition to
the robust inflow to the tornado, there is also a small but powerful
outflow with its source near the mouth of the vortex. So despite the
extreme low pressure, some of the air shoots upward outside the vortex.
The common explanation for the distinctly different airflow in the debris cloud, as
compared to the flow into the tornado, is that particulate matter stirred up by the
tornado is being ejected. Due to its mass, it experiences more centrifugal force
than the air, but due to its low terminal velocity, it drags air with it. This has
clear air moving inward, and dusty air moving outward, and the high pressure between
them is then the force that sends the dusty air shooting upward.
But if that's true, it's backwards, and self-defeating. By definition, the
centrifugal force of the particulate matter is parallel to the ground plane. If its
inertia is the dominant force, the inertia of the clear air is the subordinate. So
the clear air should lose the battle and get accelerated upward, not the dusty air.
But if that was the case, the dusty air would establish a boundary layer between the
inflow and the ground, which would prevent the fast-moving inflow from stirring up
more dust. And the dusty air would be subject to skin friction that would slow it
down, which means it wouldn't keep kicking up dust. So if a suction vortex
did stir up any dust, the dust would shoot out parallel to the ground,
which would extinguish the effect. A steady outflow, shooting upward at the
mouth of the vortex, should not be possible. Perhaps this is why a debris cloud has
never been reproduced with a suction vortex in the laboratory.
To get this sorted out, we should remember that an EF1 tornado expends millions of
watts of power at the ground, fighting skin friction, and an F5 tornado expends
billions of watts. All of that power is, of course, thermalized. We should also
remember that the inflow is hugging the ground, from at least 1 km away. This means that the temperature of the inflow rises as it approaches the
vortex.
If we then inject the present hypothesis — that the air is bound to the
ground by the electric force, and can only ascend once released from that force
— a far more plausible explanation emerges for debris clouds. The air is
positively charged, and the Earth has an induced negative charge. That means that
the dust is negatively charged, and might easily be lofted by the electric force
into the inflowing air. Once this happens, the effective charge of the air is
neutralized. If this occurs outside of the vortex wall, the air is already free to
ascend. It is still within the scope of the low pressure at the mouth of the vortex,
so that should still be the dominant force. Yet recalling that the air has been
heated by friction, we now have a context in which the air might ascend before
entering the vortex. If so much heat is generated that the air's buoyancy
is more powerful than the net inward force (low pressure minus the centrifugal
force), the air will shoot upward instead of being drawn into the tornado. Once
neutrally charged and out of the inflow, the air will find an equilibrium based on
its buoyancy minus the weight of the debris.
Figure 104. Debris cloud.
If the debris cloud is lofted 100 m, but it also contains dust,
we might come up with a guess of what temperature difference it would take by just
calculating the difference necessary to loft the air 500 m. The
pressure difference in the first 500 m of the atmosphere is 5%.
To increase the buoyancy of the air by 5%, we have to raise its absolute temperature
by that amount (per Charles's Law).
resultant temperature = 20 °C × 5% = 293 K × 1.05 = 308 K = 35 °C
So in the relevant temperature range, we need a 15 °C difference. If the tornadic inflow rate is 16,000 m3/s, perhaps the
debris cloud flow rate is 1,000 m3/s. So we need to raise the
temperature of 1,000 m3/s by 15 °C.
Raising the temperature of 1 m3 of air by 1 °C in 1 second requires approximately 1,340 watts.
unit watts = 1,340 W·°C·m3·s × 15 °C = 20,100 W·m3·s
total watts = 20,100 W·m3·s × 1,000 m3/s = 20,100,000 W
Since the continuous power output of tornadoes due to skin friction is considered to
be in the range of 5 million watts for an EF1, up to 5 billion watts for an F5, 20
million watts is within range for an EF2+ tornado.
Confirmation that temperature, not centrifugal force, is the energy source in the
debris cloud could be achieved with infrared videography from a distance, though
catching a tornado in this rare condition with specialized instrumentation (even
from a distance) would require a substantial storm-chasing effort (i.e., a lot of
money).
Sometimes tornadoes pull some or all of the debris cloud into a sheath that has a
consistent diameter, no matter how high it extends. (See Figures
105~108. See the video associated with Figure 90 to watch a dust sheath forming.)
Figure 106. Condensation funnel and dust sheath, courtesy Arkansas Tech.
Figure 107. Condensation funnel and dust sheath in southeast Colorado, credit Linda Lusk, courtesy NCAR.
Figure 108. Condensation funnel and dust sheath in Lincoln County, NE, 2004-05-22, courtesy NWS.
It has been proposed that dust sheaths are the result of particles of different
masses getting centrifuged out of the vortex at different rates.151 But tornadoes do not pull in any air above the ground level, so there is no force to
selectively impede the centrifugal force. Therefore, large particles should be
ejected rapidly, and small particles slowly, but there shouldn't be any
concentration of particles, large or small, at any specific radius.
Electromagnetism can very definitely supply such a selective centripetal force, on
the basis of the electric charge. But to understand how, we first have to identify
the charges. In the section entitled "Baseless Tornadoes" we saw that a condensation funnel defines the extents of full
neutralization. If the funnel does not reach the ground, the air at the base of the
tornado still has a net positive charge. If we take a second look at Figures 105~108, we see that all of the tornadoes have condensation
funnels that do not extend below the top of the dust sheaths. This means that the
air inside the sheaths is still positively charged. In the section entitled "Debris Clouds" we saw that airborne dust has the
charge of the Earth, which is negative. So we know that the dust sheath is
negatively charged, and the air inside the sheath is positively charged. Hence there
will be an electric field between them.
This field varies with the inverse of the square of the distance. As such, it exerts
a centripetal force on the charged particulate matter similar to the centripetal
force exerted by the low pressure on the gas molecules (which varies with the
inverse of the square of the distance also). So the dust will fall into a circular
path at the radius at which the centripetal and centrifugal forces are equal, and
this will always be at some distance from the center, as the centrifugal force is
always greater nearer the center.
The difference is that the centripetal force generated by the electric field will
also vary with the charge/mass ratio of the particle. Since we can't expect all of
the dust to have precisely the same charge density, we still don't have an
explanation for the distinct sheath.
Now if we recall that tornadoes do not pull in any air above the surface, we get our
explanation. Because a tornado is a sealed pipe, with a centrifugal force emerging
directly at the ground level that locks in the low pressure, the vortex simply
passes through the air above the ground, without pulling any of it inward,
and therefore without inducing any rotation in it. This produces a steep velocity
gradient outside the vortex wall. When dust is ejected by its centrifugal force into
this velocity drop-off, it rapidly loses its centrifugal force. Then it has no
reason to move further from the center of rotation, resulting in a build-up of dust
at the boundary between the vortex and the stationary air outside of it.
In this context, it makes sense that this phenomenon is most common in
non-mesocyclonic tornadoes, where the tornado feeds into an updraft that isn't
rotating. The air under a mesocyclone is rotating, so the velocity gradient
outside the tornado isn't as steep. This means no sudden drop in centrifugal force,
and therefore, no accumulation of particles just outside the vortex wall.
It also makes sense that the condensation funnel is pointed, when in other cases
(such as Figures 87~89) we see truncated funnels. As
the negatively charged dust is centrifuged outward, it pulls the most
positively charged air molecules outward as well, leaving weaker charges in the
center of the vortex. Where the net charge is the weakest, condensation forms first.
So, if the charge neutralization at the ground level is not complete, we will not
see condensation, even in the extreme low pressure there. Rather, condensation will
form higher up. Typically the condensation funnel is truncated, but if there is a
dust sheath, there will be a charge stratification inside the vortex, and the
weakly charged water vapor in the center will condense first.
Another sort of core-and-sheath configuration is sometimes visible in waterspouts, where the
core does not taper to a point, and the sheath doesn't fall apart when encountering the core
— rather, the core maintains a consistent radius, and extends below the bottom of the
sheath. (See Figures 75 and 89.) The
difference is that the "sheath" isn't dust particles getting centrifuged out of the vortex
— it's condensation in the vortex wall. As such, it isn't charged, so it doesn't need
a charged core to keep it organized, and the viscosity of the air is sufficient to keep it
in place.
But this doesn't mean that EM principles are not necessary to explain this phenomenon. The
core-and-sheath configuration is not possible in fluid dynamics, since the pressure should
be the same everywhere inside the vortex wall, because the pressure equalizes at the speed
of sound, and the velocities are sub-sonic. So there is no way for the pressure to be low
enough for condensation in the vortex wall, then for that pressure deficit to relax, and
then increase back to the dew point at the center of the vortex. Hence this has to be
electromagnetic.
If the condensation funnel defines the extents of the neutralization, and if condensation is
a better conductor than gaseous nitrogen, oxygen, or water vapor, the internal funnel
reveals the electrical conduit through which the current flows. This could project
all of the way to near the lower boundary before its excess negative charge would be
scavenged by the positively charged inflow.
Figure 109. Charge streams in a waterspout (with the horizontal dimension exaggerated).
This is interesting because there is evidence of downdrafts inside tornadoes moving at
30 m/s or more,149,179 as represented schematically
in Figure 110.
Figure 110. The Sullivan model, in which air flow descends from above and flows outward to meet a separate air flow that is converging radially.
Clearly, the energy source in such a flow field has to be at the base of the vortex, to
motivate the reverse flow inside the vortex, and at the same time pull air inward along the
ground. And the collision between the internal and external flows is the only way to get the
sudden change in direction in the "corner region." The critical conversion can only be
charge neutralization, releasing the thermal potential of the inflow. But the evidence of a
downdraft inside the vortex suggests that it isn't just an electric current flowing
from the main negative charge region inside the cloud, down to the positively charged
inflow. Ohmic heating would rather drive an updraft. So the downdraft is more
likely evidence of negative ions transporting the charge, not free electrons in a Townsend
avalanche. These are harder to accelerate than free electrons, and the weak electric field
shouldn't be capable of overpowering the buoyancy of air from higher altitudes. Downdrafts
are only possible when evaporative cooling increases the density of the air. Yet this is
precisely what we would expect if electrons are getting stripped to recombine with the
positively charged inflow. The loss of electrons breaks the covalent bonds holding water
particles together, forcing evaporation. The result is a heat exchange, with a corresponding
downdraft. So near the base of the vortex, the core charge becomes increasingly positive,
accelerating the air downward. When it hits the boundary, it splays outward, and collides
with the far warmer inflow, which has been released from the boundary by neutralization, and
is now rising.
In addition to the current flowing down through the tornado, there is also evidence
of a current flowing through the ground.112 The F4 tornado in
Worcester, MA, on 1953-06-09, was detected from 150 km away on
the basis of telluric currents.180 This current appears to
coincide with the tornado, so it would not be useful as a predictive
mechanism, but might nevertheless be useful to confirm the presence of a tornado,
and possibly even estimate the strength of it, which would be very valuable
information to have in real time.
The direction of the current was not identified, but the EMHD model offers a
suggestion. If there is an induced negative charge in the Earth, and if dust is
being picked up by the tornado (by the low pressure and by the electrostatic
attraction to the positively charged air flowing into the vortex), there will be a
net loss of negative charge in the Earth due to the tornado. This means that more
electrons will flow in from the environs, attracted to the positively charged air
below the storm.
Figure 111. Hypothesized telluric currents under a tornadic thunderstorm.
This agrees with electric field measurements near and inside the F4 tornado
that struck Allison, TX, on 1995-06-08.30 The strength of the
electric field was an unimpressive 3 kV/m, but the researchers
noted an interesting correlation between the electric fields and the incidence of
lightning around the edge of the storm.
The electric field at the two instruments in the vortex relaxed to zero quickly
after the lightning flashes, whereas the electric field at nearby instruments
outside the vortex did not relax quickly after the same lightning flashes.
Since it was an F4 tornado, it's safe to assume that it was kicking up a lot of
dust, meaning that there would have been a telluric current, with electrons flowing
toward the tornado. Assuming that the lightning strikes were "positive" (in which
the strikes were between positive charges in the cloud and negative charges in the
ground), the lightning would have cut off the supply of electrons toward the
tornado. The absence of electrons would be the most apparent under the tornado,
where negatively charged dust was still getting kicked up, depleting the supply.
Hence the induced negative charge in the Earth would have disappeared briefly as a
consequence of the lightning strikes. The electric field outside of the tornado
would not have been altered, as the rapid shift in the current would not have left
the Earth without any charge at all.
Tornadoes are a type of suction vortex, and the general public has come to think of them as
giant vacuum cleaner hoses that can pick up large objects in precisely the same manner as a
household vacuum cleaner picks up small objects.164,181,182 Figure 112 is taken from a video that is frequently cited as an example of the
"suction power" of a tornado.
Figure 112. Cars picked up by tornado in Leighton, AL, 2008-05-08, courtesy S&M Equipment Company. Click the image to watch the associated video.
But it's naïve to think that a typical suction vortex has lines of motion
capable of producing such levitation. For a suction vortex to bind effectively to a
boundary, the swirl ratio has to be > 1, meaning more rotation than elevation.
Figure 113. Suction vortex with roughly a 2:1 swirl ratio, courtesy Reel EFX, Inc. (To mimic a tornado with a narrow base, dust is being released just at the very center of the vortex.)
Both the tangential and the vertical velocities will accelerate objects in the flow
field, at a rate that varies directly with the skin friction and inversely with the
mass. But the tangential velocity doesn't have to overcome gravity, and if it is
greater than the vertical velocity anyway, the tangential acceleration will be far
greater than the levitation. Yet we can clearly see in the video associated with
Figure 112 that the cars were picked straight up.
This is clear proof that the lines of motion in a tornadic vortex are fundamentally
different from those in a standard suction vortex. Inside the vortex, the air shoots
straight up, forgetting its angular momentum, just like the air in the debris cloud
(if present), and for the same reason. The strong vertical velocity can only be
evidence of a powerful energy conversion near the ground, which can only be thermal
buoyancy released from an electrostatic attraction to the ground.
This upward acceleration helps account for the fact that 75 m/s winds in a tornado do the same degree of damage as 100 m/s straight-line winds. The standard explanation for the difference is that a suction
vortex can straddle a building, creating a twisting force that combines with the low
pressure above the roof to create unusual stresses.173 (See Figure
114.) This would be reasonable if tornadoes actually straddled
objects in the flow field like a suction vortex, which they do not. In reality, the
"unusual stresses" are more probably the result of an updraft that begins at the
ground level. The downward force of gravity adds strength to the walls of a
building. If that force is relieved when the building is subjected to a powerful
updraft, the walls will fail with less lateral force. This means that buildings
should be engineered to withstand 75 m/s vertical winds instead
of 100 m/s straight-line winds.
In a more general sense, it's instructive to note that tornadoes are rated by the
degree of damage, not the speed of the winds. In the early days of tornado research,
when usable tornado videos were rare, the degree of damage, measured after the fact,
was the only information that meteorologists had. But even when high-quality videos
are available, meteorologists generally won't bother doing the photogrammetry to
determine the speed of the winds, because this isn't directly related to the degree
of damage. Yet within the EMHD model, studying the discrepancy would be useful, as
it is a measure of the degree of electrification.
In addition to the effects of an updraft in or near the vortex, there is another
type of "levitation" that sometimes occurs at some distance from the vortex.
Scientists have not applied any critical scrutiny to these reports, and the common
"explanation" is flatly absurd. A tornado was nearby; tornadoes are suction
vortexes; things were picked up; any questions? Yet outside of the vortex, the lines
of motion are parallel to the ground. So the vertical motion in or near the vortex
would be irrelevant, even if the conventional framework could explain it. A critical
treatment of the topic requires that we explain how objects are picked up just with
horizontal air motion.
For example, during the tornado that hit La Plata, MD, on April 28, 2002, a bus with
30 people aboard was lifted off the ground, kept suspended in air for several
seconds, and then set back down on the wheels. While some of the passengers
had been injured by flying debris coming through the broken-out windows during the
high wind speeds before the levitation, no one was injured by the impact of
the bus coming back down after being picked up.
Here's a similar report, again from Maryland, this time from
Steve Tracton, Ph.D. (meteorology):
In 1995, I was in my car one night, patiently waiting the opportunity to turn from a
driveway onto a street in Temple Hills, MD, when seemingly out of nowhere the wind
increased to what I perceived as hurricane strength. Needless to say, I was totally
surprised and scared beyond belief when my car rose at least two feet off the
ground. Fortunately, the wind decreased as rapidly as it had increased, and my car
settled back down on the driveway.
The same kind of thing happened on 2013-05-31 to Terri Black, 51, a teacher's assistant in
Moore, OK, as reported by the Associated Press.
My car was actually lifted off the road and then set back down. The trees were leaning
literally to the ground. The rain was coming down horizontally in front of my car. Big blue
trash cans were being tossed around like a piece of paper in the wind.
Here is another eyewitness report of a car being picked up by a tornado, and a photo
of the results.
The man in the house near us was very lucky. He was in the yard and was hanging on
for dear life and watched his car raise about 5 feet in the air and float for a few
feet toward his house. The car then was gently lowered on his fence and it tilted on
its side and was gently lowered to the ground. His house was not touched and he was
next to the car and was not harmed. He was hanging on that corner post that you see
with the brace on it.
Figure 115. Damage from tornado in Zaria Svobodi, Russia, 2009-06-13, courtesy Kyle and Svet Keeton.
When further questioned on how the car came to rest in this position, the eyewitness
elaborated:183
The car actually floated after the main body of the tornado passed over head and was
out of sight. The winds were still strong but I was watching the car as was the man
who owned the car. The wind damage was done and the car just gently lowered onto the
fence. It did not crash to the ground. The fence held the car side up and the car
tipped then gently lowered on its side.
Yes, slight damage but the car was uprighted after the fence removed and driven
away. No dents except slight impressions from rocks and such as it laid on its
side...
There is no question that a car can become airborne in crosswinds above 60 m/s, which is in the EF2 range.184 (See this video for an example.) Contrary to popular belief, it is not
the Bernoulli Effect that can lift a car with low pressure above it. Rather, when
air broadsides a car, some of it gets forced underneath, and the high pressure below
the car is the force that lifts it up. But once off the ground, the car is then
rapidly accelerated in the direction of the wind, and hits the ground (for the first
time at least) 5 m or more away. Furthermore, the car will be
picked up at or before the peak wind speed has been achieved. Yet these vehicles
were picked up after the winds had begun to subside, and once picked up,
they hovered for a while before "settling back down." Lateral winds are not
capable of such effects.
Here's another example, again from Russia. It's clear that the truck had been
exposed to high winds, since the damage to the truck body would have been caused by
flying debris. But it's also clear that the truck was not rolled by the high winds.
So it was picked up and kept upright, and then set on the car. In winds strong
enough to pick up the truck, why didn't the truck get rolled? And how could the
lateral acceleration be so slight as to allow the truck to come to rest teetering on
the car like this?
Figure 116. Damage from F3 tornado in Krasnozavodsk, Russia, 2009-06-03, courtesy English Russia.
There are also confirmed reports of people being picked up by tornadoes, and
sometimes carried for some distance, and then set back down gently enough that
they were relatively unharmed. The longest confirmed distance that a tornado
carried a person who survived was 400 m.185 The person suffered no injuries when hitting the ground. A critical analysis reveals
that a fluid dynamic explanation is just not possible. A human body simply isn't an
aerodynamic shape, and even at the maximum near-ground wind speeds in a tornado
(~100 m/s), it will not generate lift in excess of the force of
gravity. So like cars, the only way that a human body can be lifted by wind is if
there is a small gap between the object and the ground into which high-pressure air
can be forced. But once the object is lifted, the high pressure is relieved, and the
object falls back down. Near the ground, it is slightly cushioned by air flowing
under it, but as the drag force accelerates the object, asymptotically approaching
the speed of the air, the cushioning effect diminishes, and the object hits the
ground. On bouncing, the process repeats, as the gap is filled with high-pressure
air that lifts the object again. This is a well-known process called saltation,
resulting in the object "skipping" across the ground. There are no statistics for
the skipping distance of a saltating human body, but since objects such as cars,
with shapes more prone to it than human bodies, typically travel no more than 5 m before hitting the ground, we can use that as an upper limit. In a
distance of 400 m, hitting the ground every 5 m would mean 80 bounces. Yet in the case cited above, the person was airborne
for the entire 400 m, which is way out of range for saltation.
And then there have been cases where entire houses have been picked up and carried,
and then set back down, damaged but still relatively intact. The anomalous aspect of
this is not that an object as big as a house could be picked up. Houses are mainly
empty space, with plenty of surface area upon which the winds can exert force. But
houses simply are not built in such a way that they can be picked up, except from
underneath, without falling apart. Without being able to get underneath the house to
pick it up, the only other way to generate the necessary uplift without destroying
the house is with a force that can act upon the entire mass at once. There are only
two such forces in nature operative at this scale — gravity and
electromagnetism. It's not gravity, because the houses were picked up. That
leaves electromagnetism.
In the EMHD model, the tornadic inflow is positively charged, and the
surface of the Earth has an induced negative charge. This means that
particulate matter from the surface that is getting blown in the wind
will be negatively charged. Objects exposed to the tornadic inflow (such
as people, cars, etc.) will be sandblasted with this particulate matter,
and will therefore develop a net negative charge. The objects will then
be attracted by the electric force to the positively charged air around
them. Since there is more air above them than below them, the net force
will be upward. And if the strongest positive charge in the storm is in
the RFD, objects will be subjected to the most powerful uplifting force
after the tornado passes.
Figure 117 shows a house that was picked up and moved by winds
that were rated EF2 (because of the removal of the roof), but the car in the garage
was left untouched. This is anomalous because EF2 winds are capable of blowing cars
off of roads, or even picking them up.184
Figure 117. House relocated by the EF5 tornado in Greensburg, KS, 2007-05-04, courtesy Tim Marshall.
It's possible that the house lost its roof in the EF2 winds, but it was not the
lateral winds that picked up the house and moved it. Rather, the house was subjected
to triboelectric charging as the tornado passed overhead, and then after the winds
subsided, the house was picked up and set back down 20 meters away by the electric force. The car inside the garage was shielded from
triboelectric charging during the strongest winds, so it did not experience the same
uplifting force later.
The exact EM configuration responsible for the levitation has not
been identified, since the electric field necessary for levitation
shouldn't be present. Let's assume that the mass of the car is
1,000 kg. The weight is then equal to m×g,
where g is 9.8 m/s2, so the force necessary to lift the car
is 9800 N. The force on a charge is given by F=q×E, thus q=F/E.
Assuming a high-end electric field of 100 kV/m, the
charge must be 9800/100,000 = 0.098 Coulombs. The problem is that if we
pack all of that charge into something the size of a car, it produces
too strong of a field. For a quick estimate, we can find the field
generated by that much charge placed on a conducting sphere with a
radius of 1 m. The electric field on the outside of the sphere is given
by:
If q is set equal to 0.098 Coulombs, the electric field at the surface
of the sphere will be 0.098 / (4 * 3.14 * 8.85 * 10-12 *
12), or 880.78 MV/m, which is 2 orders of magnitude above the
breakdown voltage of the air. If the electric force is doing the work, the
only possibility is that the field is actually that high, but that the
charge on the car doesn't dissipate because the work function of the
metal isn't exceeded. It takes 9 GV/m to liberate electrons from a cold
metal electrode. So the ambient field might be as little as 100 kV/m, but
the field concentrated the car might be 881 MV/m, and charge loss to corona
and/or arc discharges is prevented by the field still being an order of
magnitude less than the work function.
We should now take an even closer look at the most anomalous cases — the ones
in which the objects actually hovered. The reports are consistent in
asserting that the fastest winds had already passed, and the eyewitnesses guessed
the wind speeds at something like 30 m/s when the objects
started "floating." Such winds are clearly insufficient to levitate the objects, and
this section presents the more plausible explanation, that the electric force was at
work. Yet even in 30 m/s winds, we still wouldn't expect objects
to hover — the drag force should have accelerated the objects in the
direction of the wind. For example, when Dr. Tracton's car was picked up at least
two feet off the driveway, there shouldn't have been a way for it to "settle back
down" onto the same driveway. (Watch the videos of cars being picked up by high wind
speeds.) The car should have hit (first) at least 5 m off the
driveway, and Dr. Tracton probably wouldn't have lived to tell the story.
If we consider the conditions in which this will happen, we find the answer. The objects
were subjected to triboelectric charging as the tornado passed by. Then they were
levitated. This means that they were then between the RFD and the tornado. There the winds
will be traveling from the RFD toward the tornado, and we expect any object levitated in
that air to be accelerated in the direction of the winds, toward the tornado. This proves
that there has to be a force pushing the objects away from the tornado and/or pulling them
toward the RFD. And that force can only be the electric force.
So far, we have considered a positive space charge above the conducting Earth, generating an
electric field with lines of force oriented vertically. But if the RFD is the primary source
of positive charge, the lines of electric force would not have been straight up. If we look
at Figure 81, and assume that the entire RFD is positively charged,
and then consider the force exerted on a negatively charged object halfway between the RFD
and the tornado, we see that the net force will be angled upward, toward the main body of
charge in the RFD. (See Figure 118. Note that while electric lines of
force intersect a plane conductor perpendicular to it, the Earth is only an excellent
conductor below the water table, and the soil above the water table could be a good or fair
conductor. So the lines of force will not be perpendicular to the surface, but rather, to
the water table, which could be several meters below the surface.) Furthermore, the nearby
tornado has a higher conductivity than the surrounding air, which also attracts the lines
of electric force.
So
while the wind will be blowing toward the tornado, the electric force will be upward
and back toward the RFD, the net result of which could be no net lateral
acceleration. It would be a rare case indeed that the forces happened to be
perfectly matched. And so it is in fact. Nevertheless, this is the only way that
hovering in 30 m/s winds is possible.
Figure 118. Stack of positive charges above a solid conductor. Electrostatics applet by Paul Falstad.
Eyewitnesses to the destruction of houses by tornadoes frequently claim that
the houses "explode" upward and outward. The following is a quote from
UCAR on the topic.
Scientists once thought that you should open your windows during a tornado. The
thinking behind this was that the extreme low pressure in a tornado would cause the
air in your house to explode. Opening your windows would let the air expand without
damaging your house. As it turns out, houses aren't as sealed as they thought so the
air would have no problem getting out.
That much is true. But the quote goes on to say:
It turns out that the strong winds associated with a tornado can lift the roof off a
house. Without the support of the roof, the walls are blown down and they fall
outward. The roof may be dropped back on the rubble or some place nearby. This gives
the impression that the house exploded.
Are we really to believe that the walls will simply "fall outward" because there is
nothing tying them together at the top? All other factors being the same, a
vertical wall experiences no horizontal force. 30 m/s winds will
easily blow down an unbraced wall. And the wall will fall in the direction of the
winds. In winds sufficient to tear the roof off a house
(50~60 m/s), it is not physically possible for an unbraced
wall to fall down against the wind.
More problematic is the fact that the roofs are, indeed, lifted straight up, and then can
sometimes fall straight back down, or land nearby. The standard explanation for the uplift
is a set of forces known collectively as the Bernoulli Principle,186,187 but which is ignorant of simple fluid dynamic principles, and of the context in which they
are instantiated. First, even if the gable roof did not have eaves, the sharp edge at the
peak of the roof will produce an eddy on the leeward side that will eliminate the
possibility of aerodynamic uplift. (See Figure 119.)
In reality, gable roofs always have eaves, and if these are taken into account, the shape of
the roof doesn't even matter. In an EF1 tornado, the winds only do shingle damage near the
peak. (See Figure 120.) In an EF2+ tornado capable of removing the roof,
the upper surface is actually in an eddy (not shown) with pressure near ambient. This means
that the force that tears off the roof can only be high pressure under the eave. The roof is
then pealed back, like the lid of a sardine can, and it is to be found nearby, upside-down,
and with most of the shingles still attached (except near the peak).
Figure 120. Airflow over a gable roof with eaves, given 3 different base rates.
This leaves us without an explanation for roofs getting lifted straight up and falling
straight back down. If it's not aerodynamics, the only other possibility is that it's the
electric force. If so, there are two possible signs of charge that could be at work, and
there aren't enough data to distinguish between the two. It's also possible that
either sign of charge could dominate, for different reasons, and that some of the
distinctive behaviors are evidence of which sign was present.
First, it's possible that the house becomes negatively charged, by getting
sandblasted with negatively charged particulate matter, or by ingesting such
particles through broken-out windows. Once the house develops a negative charge, it
will be attracted to the positive charge aloft. This is the more likely explanation
if the entire house gets levitated (as discussed in the previous section). It might
also explain cases in which just the roof was picked up, which then hovered until
flipping over, releasing a cloud of dust. The suggestion here is that the dust was
negatively charged, and as such, it exerted an upward force on the roof, and kept
the roof suspended in the air until the roof flipped over.
The other possibility is that the house becomes positively charged. If there is
little or no dust in the tornadic inflow, the space charge of the air itself will
dominate. As the positively charged air flows through, around, and over the house,
it pulls electrons out of the house, leaving it positively charged. In this case,
the electric force that would cause the "explosion" would simply be the
electrostatic repulsion of each piece of the house from each other piece. If the
structure fails, the pieces will be accelerated upward and outward (simply
away from each other), and then they will fall to the ground.
One of the implications of a positively charged house is that it will be structurally
weaker. Ionization loosens the covalent
bonds that give solids their strength. So the factors acting on the house might
include all of the following:
lateral and/or vertical aerodynamic force,
electrostatic repulsion, and
weakened structural beams, posts, and fasteners.
This might also help explain why building materials (such as lumber) seem to
"disintegrate" under the force of a tornado, to a degree that cannot be explained
simply by the force of the winds. Some damage assessments have explicitly mentioned
the surprisingly small size to which everything was reduced. This would make more
sense if all of it had a strong positive charge, and therefore did not have its
normal strength.
Another observation that might be related comes from the "Thunderstorm
Project" (1946-1949), in which pilots flew WWII fighters fitted with weather
instruments into thunderstorms. One pilot reported that the interior of the storm
suddenly changed from jet black to bright yellow, accompanied by constant electrical
activity. At the same time, personnel on the ground observed a tornado descending
from the wall cloud that had formed. When the pilot returned to base and the plane
was inspected, it was found that rivet heads had been peeled off of the wings.
Interestingly, the pilot did not report experiencing G forces sufficient to cause
such damage.188,189
The bright yellow color can only be reasonably explained as a glow discharge in
highly ionized air. (See Figure 56 for the
emission spectra of hydrogen, nitrogen, and oxygen.) Other reports of cavernous
voids inside thunderstorms suggest that this was not a fluke, while the colors are
more typically blue~green, which would be emissions from ionized nitrogen and/or
water molecules. In the EMHD model, positive double-layers build up around
recirculating negative charge streams. Being positively charged, the water content
will be entirely gaseous, explaining the emptiness in the middle of a storm. A
positive double-layer on the inside of the recirculation could be
especially charged, and could support a glow discharge between it and the negative
charge stream around it. And flying through air with a strong positive charge could
have resulted in rivet heads being weakened.
There have also been numerous cases of unusual combinations of strength and weakness
in the collisions of objects in tornadoes. Some of these are easily explained away.
Figure 121 is frequently cited in cult literature as an example
of the bizarre things that a tornado can do. It is easy to understand how a
projectile moving at 100 m/s could penetrate wood. The hard
part is understanding why the vinyl didn't shatter.
Figure 121. A phonograph record blown into a telephone pole, courtesy NOAA.
It is somewhat more plausible to assume that the record did not get driven into the
windward side of the pole, but rather, into the leeward side. With
100 m/s winds against the pole, it would have been leaning,
and this means that cracks in the wood (clearly visible in the photograph) would
have opened up on the leeward side. Airborne debris could then fall in behind the
pole, trapped in the eddy downwind of it, and then be drawn toward the pole. A piece
of debris could then happen to get wedged gently into one of the cracks in the wood.
After the winds subsided, the pole would have straightened up again, closing the
cracks, and then gripping the debris tightly.
Other cases are harder to explain away, such as the board that was rammed through
another board in Figure 122, and pieces of
straw that were driven into telephone poles.
Figure 122. Damage from the Tri-State Tornado, 1925-03-18, courtesy NOAA.
Some of these cases are explicable just with Newtonian forces, but all of
them become far easier to understand if the objects in question had been ionized.
To summarize this and the previous section, we can expect shorter objects (such as
people and cars) in the tornadic inflow to become negatively charged as they get
sandblasted with saltating particulate matter. They will then become candidates for
levitation. Taller objects (such as houses) might be more prone to positive charges,
where the ionization, combined with aerodynamic forces, compromise their structural
integrity, in which case they will appear to "explode."
Tornadoes are famous for the wide variety of forms that they can take, and for how
fast they can change. Especially in the "rope" stage, a tornado can even achieve a
horseshoe shape, where the vortex goes up, back down some, then back up again and
into the cloud.
Figure 123. Rope tornado in Laramie County, WY, 1990-05-24, courtesy Stephen Hodanish.
Figure 124. Rope tornado near Lawrence, NE, 2004-05-24, courtesy NC911.
This doesn't seem to be problematic for the thermodynamic regime, as a
suction vortex is easily capable of dramatic undulations. For example, see Figure
62. But that isn't a bottleneck vortex, as in Figure 99, where there is an extreme low pressure at the lower boundary.
Laboratory experiments with bottleneck vortexes have never produced such
undulations, because both ends of the vortex are firmly attached to something, and
any force that would lengthen the vortex would have to further decrease the pressure
in the core. So the low pressure keeps the vortex perfectly straight, like a tight
rubber band. We would expect bottleneck vortexes in nature (i.e., tornadoes) to
behave the same way — even rope tornadoes, which can still do F5 damage.190
To understand how these undulations could be possible, we first have to acknowledge
that a tornado is really only attached firmly to the extreme low pressure at the
ground. So there isn't an extreme low pressure running through the entire tornado,
where undulations would further reduce the pressure throughout, as if it was a
sealed pipe, with a fixed volume/pressure ratio. Consider, for example, tornadoes in
which the laminar flow at the base gives way to turbulence (such as in Figure 96). It would be more correct to say that the energy conversion is
at the ground level (where the neutralization of electric charges enables thermal
potential to become kinetic), and that the upper portion of the tornado is just the
exhaust from the energy conversion at the ground level. We can expect the air to
rise more or less vertically for the first several hundred meters, until it has
reached the altitude prescribed by its temperature, which we expect to be 10~20
°C above ambient. From there, it will head for the lowest pressure inside the
cloud, but might actually travel more or less horizontally at the equilibrium
altitude to get there.
As an interesting sidenote, there were a couple of tornado tour groups who witnessed
the event in Figure 124. Randall Oliver made a video of the tornado, and here is his description:191
As the tube snaked down and out horizontally from the original wall cloud, and then
made the 90° bend toward the ground, at the bend there was another wall cloud,
while the tornado was still attached to the original wall cloud about
1⁄2 mile horizontally to the north. No one that I know has ever
seen this phenomenon before.
Two wall clouds mean two updrafts, an atypical but nevertheless well-known
phenomenon. But for a tornado to start at the ground under one, and then cut across
the inflow to that updraft, travel 1⁄2 mile, and then enter the
cloud in another updraft, is unique. It is also completely outside the principles of
fluid dynamics. The low pressure core of one updraft is not going to cut through the
isobars to get into the core of another low pressure. This is clear (albeit unique)
evidence of another force that is not fluid dynamic, and that is robust
enough to maintain an organized structure, in rare cases in spite of fluid
dynamic forces. That can only be an electron stream flowing through the conductivity
of the vortex to get to the positively charged air at the ground.
Occasionally, more than one tornado descends from the same mesocyclone. Sometimes
there is one central tornado, and one or more satellite vortexes. In rare cases,
twin tornadoes of relatively equal strength form.192
Figure 125. The 2nd oldest known photograph of a tornado, showing a central vortex and two satellites, southwest of Howard, SD, 1884-08-29, credit F. N. Robinson, courtesy NOAA.
Figure 126. Twin tornadoes that did F4 damage in Dunlap, IN, 1965-04-11, courtesy Paul Huffman.
Multiple concurrent vortexes are not terribly unusual in fluid dynamics. But
multiple, extremely powerful, steady-state vortexes, close to each other,
are somewhat more difficult to understand. If nature hates a vacuum, then nature
really hates two of them close together that refuse to merge into a unified
low pressure system. The pressure gradients around vortexes radiate in all
directions, and between two vortexes, the pressure will be twice as low. This will
pull the vortexes together, and they will merge. (This is known as the "Fujiwhara
effect.") So the twin tornado configuration is the toughest to understand.
It might be significant to note that the rare steady-state twin tornadoes have all
been F4s. As bottleneck vortexes, each F4 tornado is expending billions of watts
fighting skin friction on the ground. Since skin friction varies with the square of
the velocity, combining both F4 tornadoes into one (F?) tornado would have required
far more power to move the same amount of air. So there might be a threshold above
which the bottleneck vortex is more stable in the twin configuration, and there
might never be an F6 tornado — anything above an F5 will split into two F4s.
A study of the damage paths of extremely powerful tornadoes reveals that the damage
is not distributed evenly within the tornado, but rather, is focused in a far
smaller area, sometimes in the center of the tornado, and sometimes in a path that
meanders within the width of the funnel cloud.193,194 In other
words, an F5 tornado might be over 2 km wide, but the extent
of the F5 damage might be less than 500 m wide. (See Figure
45 for an example.) Figure 127 shows a
similar pattern. (Note that in the center of the damage path, there wasn't anything
left by which the wind speeds could be gauged — the engineers could only guess
that the winds had to be in the EF 4~6 range to cause such complete destruction.)
Figure 127. Damage path in Greensburg, KS, 2007-05-04, courtesy FEMA.
Doppler radar studies have clearly shown that tornadoes can have eccentric
sub-vortexes.152 (See Figure 128.) Some researchers
believe that the most extreme damage is done by the sub-vortexes. This would explain
why a tornado might totally destroy one house, and spare the house next to it, even
though both houses were definitely fully inside the same funnel cloud.
If the sub-vortex is more powerful than the main vortex, then we have a
non-continuous pressure gradient inside another pressure gradient, which doesn't
make sense. This constitutes rigorous proof that there are two sets of factors
producing these vortexes. So what are they?
We already have the answer, because we have already identified two different flow
fields under a supercell, caused by two different sets of factors. There is a flow
field associated with the mesocyclone, and there is a separate flow field associated
with the tornado. And the tornado occurs inside the context of the
mesocyclone's flow field. It's possible that the main vortex is the inflow to the
mesocyclone, which has descended and grown so powerful that it becomes airlocked at
the lower boundary. The large volume of air flowing into the mesocyclone, at a
slower rate, results in an extremely wide vortex (over 2 km), but
relatively weak winds (EF2 or below).
Yet before the mesocyclone "descended," the tornado (to become the sub-vortex) was
already established. The extreme low pressure inside that vortex makes it
the best conduit for the flow of electrons down from the cloud, and this conduit
persists. The reason is that it is maintained by mutually-enhancing factors. The
lower the pressure, the greater the electric current, and the more current, the more
buoyant the air, which further decreases the pressure. When the mesocyclone
"descends" and latches onto the ground, the air supply to the sub-vortex is
restricted. This further decreases the pressure inside the sub-vortex, making it an
even better conduit, resulting in more complete charge neutralization, and the most
extreme energy release possible inside the sub-vortex.
So the air flows in from all around. Any air that isn't charged, or is weakly
charged, can flow up into the (mesocyclonic) outer vortex. The more highly charged
air still refuses to break away from the ground, and flows into the sub-vortex,
where it gets neutralized and sucked up into the sub-vortex. Air that finally gets
into the sub-vortex was pre-heated as it flowed toward the main vortex, re-heated as
it slid under the main vortex wall, and heated some more on its way into the
sub-vortex. Complete charge neutralization inside the sub-vortex then results in an
instantaneous release of all of that thermal energy.
Somewhere in the range of 85%~95% of all cloud-to-ground lightning is "negative,"
wherein the discharge is between a negative pole in the cloud and a positive
pole in the ground.195 This is easy to understand, since the main
negative charge region is lower in the cloud (and therefore closer to the ground)
than the main positive region, hence an arc discharge can occur with less voltage,
so it happens more frequently. Lightning from the main positive charge region at the
top of the cloud down to the ground requires upward of 100 million volts to initiate
an arc discharge, so it is a bit more rare.
This does not mean that all positive strikes have to come from the upper
portion of the cloud. Weaker positive charge regions can develop lower in the cloud,
resulting in positive strikes with less voltage. But usually, the lower positive
regions are too weak to initiate lightning, and negative strikes dominate the
statistics.
The interesting thing about supercells is that they develop as "normal"
thunderstorms, with a negative charge in the middle of the cloud inducing a positive
charge in the Earth. Then typically there is a polarity reversal as the storm enters
the tornadic phase, and the charge aloft becomes positive, with an induced negative
charge in the Earth. The CG lightning issued during this phase is predominantly (or
even exclusively) positive.133,196,197 Shortly after the tornado
ropes out, the polarity reverses again, back to the "normal" configuration.
This is anomalous because we can clearly see the internal structure of the storm on
Doppler radar, and there is no change in storm structure that accompanies these
polarity reversals. This might sound trivial, but it is not. While protons and
electrons have exactly the same amount of charge (though opposite in sign), they
have very different physical characteristics. In a thunderstorm, negative
charges are found mostly in hail and to a lesser extent in large raindrops, while
positive charges are carried by microscopic ice crystals, supercooled aerosols, and
by nitrogen and oxygen molecules that collide with positively charged water
molecules. Since hail is the best radar reflector in the storm, with large raindrops
being good reflectors, and since these are the primary negative charge carriers, we
should expect the negative charge regions to correspond roughly to what we see on
radar.133,134,135 The significance of this is that a polarity
reversal should be accompanied by a visible change in the storm structure
on radar, but it is not.
In the standard model, this is not a solvable problem, because all of the electric
charges are assumed to be in the cloud, carried by water molecules. No existing
construct asserts that the air between the cloud and the ground might be bearing a
powerful electric charge. Hence the polarity reversal, without a corresponding
change in Doppler radar, is inexplicable.
The more reasonable interpretation is that if the radar data are telling us that the
main negative charge region is still there, its charge is still there too. If the
perceived electric field at the surface inverts, then a positive double-layer has
come between us and the negative charge region. Hence the combination of the radar
and electric field data constitute one of the proofs that during the tornadic phase,
the air below the cloud is bearing a strong positive charge. When this double-layer
dissipates, the tornado ropes out, and the polarity returns to normal (showing a
negative charge aloft).
The "lightning hole" was mentioned earlier, and an example is clearly visible in
Figure 72. While the "hole" is not absolute, and lightning
does occur within this region, there is typically a 50~70% reduction in
lightning strikes.117,118,119,120 Figure 129 shows
the typical time frame in which the reduction occurs.
Figure 129. Reduced lightning strike rate before and during the tornadic phase of a storm in Atlanta, GA, 1975-03-24, courtesy Georgia Tech.
The absence of lightning coincides with the polarity reversal (as mentioned in the
previous section). "Normal" thunderstorms and developing supercells typically show a
negative charge aloft, with an average field density of 10~15 kV/m. In the polarity
reversal, this relaxes to zero and then climbs slightly up the positive scale,
stabilizing at 3~5 kV/m. While the inversion persists, the field density stays low,
and there is a distinct reduction in the lightning rate.
In the standard model this makes sense, as the cloud base is thought to switch to a weak
positive charge during the tornadic phase, when the weak field supports less CG lightning.
But the EMHD model maintains that the cloud is negatively charged the whole time, while
during the tornadic phase, a positive double-layer shields the negative charge in the cloud
from instrumentation near the ground. The main field is then between matched positive and
negative charges aloft. (See Figure 73.) Still, the positive
double-layer is closer to the ground, so the Earth gets an induced negative charge, and near
the ground we measure an "inverted" field, where the charge aloft is positive. The field is
weak, but that's just because we're only measuring the field between the outside of a
shielding layer and the adjacent solid conductor (i.e., the Earth). The voltage in the main
field (between the cloud and the air just below it) might actually go up (perhaps
way up).
This then begs the question of why the "main field" doesn't produce even more lightning. It
would be CC instead of CG, but the voltage should be higher, and the distance less, so the
flash rate should go up, not down.
It's possible that the discrepancy is coming from the fact that electric fields and
lightning rates are not actually directly related, and it's easily possible for the
electric field to be well beyond the normal threshold for lightning, without
discharges occurring. In the laboratory, at standard temperature and pressure, it
takes 3,000 kV/m to get an arc discharge in the air. So this is a physical limit
that cannot be surpassed, and which is known as the breakdown voltage of the air.
Interestingly, lightning becomes probable in fields over 20 kV/m, and virtually
certain in fields over 30 kV/m. So meteorological literature talks about 30 kV/m as
if it's the breakdown voltage, when really it's only 1⁄100 of the
required field. So how is lightning even possible at 30 kV/m?
The answer is that lightning is not a simple, instantaneous arc discharge —
it's a complex process. It starts with a flash inside the cloud less than
100 m long, where the potential has exceeded the breakdown
voltage of the air. Then, in a process that sometimes lasts several seconds, the
lightning channel elongates. Each stepped leader occurs in a local field in excess
of the breakdown voltage, but this process can continue until distant
regions with a resting potential far below the breakdown voltage can eventually
become connected by a discharge channel. So the electric field meter might be
showing only 30 kV/m, but a couple of microseconds before it gets struck by
lightning, the field jumps up to 3,000 kV/m, and no physical principles have been
violated.
The significance of this is that without the initial flash, the whole process never
would have been initiated, and we should theoretically be able to see close to
3,000 kV/m of potential without there being any lightning.
Then the critical question becomes: what causes the initial flash? The quick answer
is that nobody knows for sure. It shouldn't be possible to develop the charge
densities necessary for an arc discharge, when the charges are held by the air
itself, as electrostatic repulsion should prevent them. But we do know that
lightning occurs in a turbulent environment. Some of the lay literature states that
colliding parcels in a turbulent flow generate static electricity that sets off the
lightning strike. It's probably more accurate to think that turbulence simply brings
oppositely charged parcels closer together far more rapidly than we'd see in a
laminar flow, and this is what increases the local field density beyond the
breakdown voltage.
Now if we consider the context in which tornadoes occur, we see large, very well-organized
laminar flows, in the mesocyclone and in the positive-double layer. As such, these parcels
might lack the lightning triggering mechanism, and might therefore be capable of up to 3,000
kV/m of potential before hitting the absolute limit. In fact (as we'll see in the section
entitled "Corona Discharges"), corona discharges are
occurring outside of the vortex. At the standard temperature and pressure outside of the
tornado, corona discharges require 100 kV/m of potential — well above the typical 30
kV/m in which lightning occurs, while being 1⁄30 the requirement for an arc
discharge. So we know that the "normal" threshold for lightning is being surpassed in
tornadic storms, without there being any lightning. We also know that after the tornadic
phase, the lightning rate jumps way up, even though the storm is weakening, and therefore,
is manufacturing less charge separation. This only makes sense if the electrostatic
potentials were building up the whole time, but couldn't get discharged during the tornadic
phase due to the lack of a triggering mechanism. So the spike in the lightning rate after
the tornadic phase is the discharge of the potential that built up during the tornadic
phase.
And there is a significance here that is far broader than just accounting for a lightning
hole in the presence of increased electric charges. In the section entitled "Strategies," the following statement was made.
The EM forces need not be powerful, even by thermodynamic standards. [...] In a
supercell, weak EM forces resolve into a structure, and the sum of the effects of
the weak forces produces a new property set.
Now we can see how this can happen. A large laminar mesocyclonic structure enables a great
deal more charge to be stored inside the storm than would be possible otherwise. Then
distinctive EM phenomena are observed.28,29,30,31,32 It's possible that
the large laminar structure, the massive amounts of electric charge, and the distinctive
discharges are all parts of a fully coupled EMHD system. The charge delays the transition to
turbulence, which then reduces the amount of potential that gets discharged in lightning,
which allows greater charge densities in larger, more organized structures. Then a new
property set emerges, including a mesocyclonic recirculation, with a negative core and a
positive double-layer, and with the capability of instantiating a tornadic flow field.
In other words, we knew before we began that we were looking for a rare combination
of factors that somehow produced behaviors that shouldn't be physically possible.
The positive feedback loop identified in the present work is just that kind of
combination, and the expected properties of the weak but well-organized EMHD
structure match the observations.
Tornadic storms produce sustained RF emissions in the range of 20~140 MHz.17,198,199,200 Also, there appears to be some sort of causal relationship
between higher frequency emissions and extremely powerful tornadoes.
One source of sustained RF emissions could be small-scale arc discharges at the top
of the cloud, where the charge separation process begins.201 But
discharges at the top of the cloud would have no obvious causal relationship with
the tornado at the bottom of the cloud. Another theory is that the waves are
generated by rotating charges in the tornado.202 But no explanation
is given for how a vortex rotating at less than 60 rpm would generate waves at
20~140 MHz.
Given that the specified relationship is between tornadoes and RF
emissions, the most logical place to look for the source of the emissions is inside
the tornado. We know that there is an electric current inside the tornado,
sufficient in rare cases to create glow discharges, and in extremely rare cases, arc
discharges at the tornado/mesocyclone interface, visible from the outside. The fact
that the distinctive RF emissions are far more consistent than the observations of
tornadic lightning indicates that the discharges are normally hidden inside the
cloud.
The frequency of RF emissions from lightning is a function of the distance traversed by the
moving electric charges. While there is an ongoing surge of charged particles flowing in one
direction, the surrounding electric and magnetic fields are being modulated. When the flow
stops, the fields revert to their resting state. If there is a return stroke, the polarity
of the fields reverses. The result is waves whose period is a function of the duration of
the surge, which is a function of the distance that is traversed. Assuming that the speed of
the electrons in lightning is 1⁄10 the speed of light,203 or roughly 30,000,000 m/s, we can develop rough numbers for the
length of the lightning channel, given the frequency of the RF emissions. For example:
speed = 30,000,000 m/s
frequency = 30 kHz = 30,000 cycles / second = 1 cycle per 1/30,000 s
distance = 30,000,000 m/s × 1/30,000 s = 1,000 m
Please note that the distances being described here are not the wavelengths. The
field modulations occur over a period of time defined by the distance of the particle
traversal, while the waves propagate at the speed of light. As an analogy, a wire might move
back and forth in a magnetic field once per second, traversing a total of 1 m. This will produce an electric current having a frequency of 1 cycle per second.
The electric current flows at near the speed of light, with a wavelength equal to the
distance that light can travel in a second (300,000,000 m). So
the distance traveled by the prime mover, and the wavelengths produced, are totally
different.
The following table shows a representative sampling of frequencies, and the
distances traversed to generate them.
Table 3. RF Emissions
band
frequency
length
VLF
30 kHz
1,000 m
AM
520 kHz
57.69 m
AM
1610 kHz
18.63 m
TV
54 MHz
0.56 m
Since most lightning traverses 1~3 km, most of the RF energy
is in the VLF band (3~30 kHz),111,204 with enough energy present in
the AM band (520~1610 kHz) to cause radio static. The RF interference created by
tornadoes in the TV band (54~216 MHz) is of sufficient amplitude, if the tornado is
within a couple of kilometers, to overpower the TV signal,
resulting in a screenful of snow.205 The discharge channels
associated with such interference would be less than 0.56 m long, and it's possible that these correspond to the reports of "lightning fingers"
inside the tornado.161,162,163
Note that the high-frequency emissions are only detectable with a TV set if the
tornado is within a couple of kilometers. It doesn't take very
many watts of power to transmit RF energy that distance.
While the distinctive high-frequency emissions do not precede the tornado, so they
cannot be used to predict tornadoes, they might be useful in
verifying tornadoes. 77% of all tornado
warnings are false alarms, so not everybody takes aggressive defensive action when
they hear the sirens. But a confirmed tornado on the ground is a different issue.
Unfortunately, there isn't always someone there to make such a confirmation. But
radio waves can be detected from a long distance (with instruments more sensitive
than a TV set), so real-time monitoring of these emissions could lead to more
reliable nowcasting.
There have been many reports of the smell of ozone in the area around a tornado.
Since high-voltage electric equipment (such as arc welding) produces ozone, people
have frequently characterized the smell as "electrical," and this was one of the
"clues" that led researchers to believe that lightning at the tornado/mesocyclone
interface was the driving force in tornadoes.
It's actually a bit odd that they did not fully consider the implications of this
line of reasoning. Because the air under a mesocyclone is converging toward it, if
ozone is present and it's coming from the tornado/mesocyclone interface, it
certainly did not travel against the converging winds to get to the people on the
ground. It had to rise through the updraft, and then get pulled all of the way back
to the ground (as the FFD) in order to be smelled at the ground level. Figuring out
how this ionized oxygen could get pulled back down to the ground would have led them
to consider 40 years ago the ideas being presented now in this paper. Regardless,
the researchers contended that tornadic lightning had to be present in order to get
an updraft powerful enough to produce a tornado, and when that was proved false, the
whole EM paradigm was tossed.
The source of the ozone could, indeed, be tornadic lightning, but it could also be
simply a product of the ionization that is occurring in the charge separation
process at the top of the cloud, magnified by particle sorting en route to the
tornado. So positive charges in the RFD and FFD will increase the amount of ozone,
and as the ions will be more attracted to the Earth than neutral particles, people
on the ground will sense the chemical difference.
And while the EMHD model does not place any central significance on tornadic
lightning, it does rely heavily on ionization as a necessary condition for
tornadogenesis. So the presence of ozone at the ground is not just an artifact of
tornadic lightning, or of the charge separation process. It is an index of the
degree of ionization in the air, and the EMHD model asserts a causal relationship
between that and the probability of tornadogenesis.
Tornadoes also create a variety of distinctive sounds.131,206 The
"freight train" sound is commonly reported, which is also likened to the roar of a
jet engine at full throttle. The standard explanation is that the violent turbulence
in the air creates random sonic events that combine into a continuous roar. But this
doesn't explain why the roar of an EF3 tornado is distinctly different from the howl
of a Category Five hurricane, both with the same wind speeds.
The following is a report from directly under a mesocyclone as the funnel cloud was
just forming (later to touch down 20 km away).207
As the sound of thunder would approach from the distance, the "growl" of thunder
would sound like it was being trapped in the vortex overhead producing a sound very
similar to what an old steam train sounds like when it pulls out of the station
— whooomf, whooomf, whooomf... and fade away after several seconds, until the
next roll of thunder came along then another whooomf, whooomf, whooomf... overhead.
The most plausible explanation for thunder "growling" repetitively, instead of
booming just once, is that the thunder was interacting with the low pressure inside
the mesocyclone. Since the speed of sound in air varies with temperature, and since
the low pressure inside the mesocyclone reduces the temperature, sound will travel
through the mesocyclone slower than around it. This will create a "clap" on the
other side, which will then reverberate back through the mesocyclone. If this effect
lasts several seconds, and if there are several lightning strikes per second, and
other sonic events due to turbulence in the air and object-object collisions at the
ground, the reverberations will merge into a continuous roar. So it would be the
low pressure inside the tornado and/or mesocyclone that would be responsible for
this distinctive roaring sound, not just random sonic events.
Then there is another sound that is reported and that is quite different, and which
seems to be associated with just the funnel cloud, though it is only heard
before the funnel cloud touches down. This has been characterized as a
hissing, whistling, whining, humming, or buzzing sound. The following is a
description of the sound made by a funnel cloud in Dodge City, KS, on
1928-06-22.208
At last the great shaggy end of the funnel hung directly overhead... There was a
screaming, hissing sound coming directly from the end of the funnel... Around the
rim of the great vortex (about 50~100 ft. diameter) small tornadoes were constantly
forming and breaking away... It was these that made the hissing sound.
This higher-frequency sound is thought to be the same as the low frequency sound
generated by the mature tornado, though while the funnel cloud is still in the air,
the sound of smaller sub-vortexes is not overpowered by the roar of the main vortex
on the ground.209 But again, the howl of high winds is well-known,
and can be reproduced in the laboratory easily, while the distinctive hissing or
buzzing sound has never been reproduced just with high winds.
People who have heard this sound, and who also have worked around high-voltage
electric equipment, always equate the sound with that of a sustained discharge
through the air. Those who have witnessed St. Elmo's Fire (a corona discharge)
report the same hissing sound. If there is an electric current flowing through the
tornado and into the inflow, and if the bottom of the funnel cloud is where negative
and positive charges are meeting, it will certainly produce precisely this kind of
sound.
St. Elmo's Fire is a corona discharge that produces a blue or violet light when it occurs in
the presence of nitrogen and/or oxygen. It emanates from pointed objects in an electric
field exceeding 100 kV/m.160 It is most commonly
observed at the end of a thunderstorm, and sailors named it after St. Elmo (their patron
saint), believing that he had once again delivered them from the perils of a storm at sea.
The same blue/violet halos can be seen around lightning, and around electrical equipment
generating sufficient voltages. (See
Figures 130~132.)
Figure 130. Lightning. Notice the small violet corona discharge. Courtesy Johnny Autery.
Figure 131. Corona discharge from a tesla coil, courtesy Robert Hunt.
Figure 132. Sustained sub-station fault with a surrounding violet corona discharge in Corvallis, OR, 2005-10-30, photo courtesy Stonebridge Engineering.
Corona discharges in the atmosphere are a rare occurrence, and are a bit difficult to
explain, since they seem to require more electrostatic potential than lightning. If
the contentions in the section entitled "Lightning Holes" are correct, corona discharges are definitely possible. 100 kV/m for a corona discharge is well below the 3,000 kV/m necessary for an arc discharge, and fields greater than 150 kV/m have
been measured many times in the absence of lightning.210 But we'll only see
corona discharges when turbulence is not initiating lightning strikes. This will most likely
occur at the end of a thunderstorm, when charged downdrafts are undercutting the updraft,
and electrostatic potentials are still present, but the vigorous airflows are subsiding.
A brilliant series of such discharges was captured on video recently, a couple of hours
after a line of severe thunderstorms passed through Ft. Worth, TX. It's possible that
charged downdrafts were clinging to the conductivity of the Trinity River, and where the
river intersected high-voltage power lines between Beach Street and Handley Ederville Road,
the towers provided the pointed objects necessary to trigger discharges. The blue flash in
Figure 133 is an electron avalanche in ionized nitrogen and oxygen. The
orange in Figure 134 is a more vigorous discharge in highly ionized
oxygen. The violet in Figure 134 is neutrally charged air. As the
chemical composition of the air certainly wasn't changing from one flash to the next, the
different colors were an indication of the voltages present, with violet requiring the
least, and orange the most.
Figure 133. Corona discharge in Fort Worth, TX, 2011-05-10, courtesy Brian Luenser.
Figure 134. Corona discharge in Fort Worth, TX, 2011-05-10, courtesy Brian Luenser.
Figure 135. Corona discharge in Fort Worth, TX, 2011-05-10, courtesy Brian Luenser.
Interestingly, corona discharges have been observed under supercells, outside of the
tornadoes (if present) while the storms were still quite active.31 NASA scientists stationed in Huntsville gave detailed reports of the numerous colors
associated with the storm pictured in Figures 136 and 137, while only blue and orange flashes were actually
photographed.211 Some of the reports were from plasma physicists,
who explicitly identified the elements and ionization levels on the basis of the
colors. Such discharges prove that supercells are doing something to
prevent the lightning initiation process, allowing electrostatic potentials to far
exceed the normal threshold for lightning.
Figure 136. A luminous discharge outside a tornado captured on video (at 9 frames/sec) in Huntsville, AL, 1974-04-03, courtesy Otha H. Vaughan.
Figure 137. Two photographs of the luminosity (taken about 31 seconds apart) from a tornado in Huntsville, AL, 1974-04-03, courtesy W. M. Dobbs.
Here's another more recent example, also from Huntsville.
Figure 138. Blue flash as EF2 tornado was forming in Huntsville, AL, 2010-01-21, courtesy printfac.
Blue and orange flashes were captured by a security camera in Millbury, OH. There
were 4 blue and 2 orange flashes just in a 6-second period. In Figure
139, the right side of the tornado itself is silhouetted by the
orange flash.
Figure 139. Orange and blue flashes around tornado that did EF4 damage in Millbury, OH, 2010-06-05, courtesy DRACONi Security Agency.
Even more recently, sustained orange flashes were captured by a security camera in
Chattanooga, TN, immediately after a tornado. The flashes were thought to be fires
started by the tornado. But the flashes in the video emanate from lightpoles, which
have no fuel to sustain fires of such intensity. And despite the high wind speeds,
the flashes maintain a (more or less) vertical form, instead of being blown in the
direction of the winds as we would expect. Furthermore, the lights were not damaged
by the "fires."
Figure 140. Orange flashes following tornado in Chattanooga, TN, 2010-10-28, courtesy U.S. Army Corps of Engineers.
Flashes originating from point-sources on the ground are typically attributed to
transformers blowing up when power lines short-circuit. But this doesn't explain the blue
and orange colors. When a transformer blows up, the arc discharge is bright enough to
saturate some or all of the affected frames. Outside of the whited-out areas, there is
little to no corona. If there is a corona, it is violet. (See Figures 130~132.) The presence of large coronas, and their color, constitute direct evidence of
highly ionized air, one of the central tenets of the EMHD model. Blue could either be
ionized nitrogen or oxygen. Orange can only be ionized oxygen. (See Figure 56 for the emission spectra.)
Cloud-base striations sometimes appear under the mesocyclone, and are known by their
nearly circular form, with nearly horizontal, semi-continuous features. The form
suggests lines of motion, but the actual rotation is slight.
Figure 141. Wall cloud and cloud-base striations in Ravenna, NE, 2002-07-24, courtesy Gregg Hutchison.
Figure 142. Wall cloud and cloud-base striations in Canton, OH, 2007-08-09, courtesy Weather Underground.
Figure 143. Cloud-base striations in Childress, TX, credit Carsten Peter, courtesy National Geographic.
The standard explanation is that these are simple extensions of the rotation within
the mesocyclone. In other words, the mesocyclone is rotating, so other stuff around
it will start rotating too. There is also a rotation in the surface inflow (even if
a tornado has not formed), that might help "spin up" the striations from the inside.
It's important to note that the circular form clearly reveals that this air is not
flowing into the mesocyclone — otherwise we'd see a spiral pattern. And if the
air was simply "spun up" by exterior and/or interior rotation, there would have to
be a perfect balance between the low pressure inside (to create a centripetal force)
and the centrifugal force of the rotation. Then, the low pressure, distributed by
the opposing centripetal and centrifugal forces, would encourage condensation.
While such an explanation is possible, the EMHD model suggests another
explanation that is equally possible. It also might be that a combination of factors
contributes to this form.
A steady charge stream from the cloud toward the ground will generate a magnetic
field (i.e., Ampère's Law). This magnetic field will not induce any rotation
in the surrounding air. But since water molecules are diamagnetic, they
will get oriented according to the magnetic field.212 Interestingly, molecular orientation is a necessary step in the condensation
process. Hence it's possible that the limits of the condensation that make up the
cloud-base striations are evidence of water vapor that is almost ready to condense,
and that gets a little help from a magnetic field.
The condensation process then explains the conversion to a turbulent flow above the
striations in Figure 143. Condensation releases latent heat,
which causes an updraft. This updraft has nothing to do with the surface inflow, or
with whatever is going on inside the mesocyclone. It is merely an artifact of
condensation within the striations themselves.
It also makes sense that the cloud-base striations have a flat bottom. By
Helmholtz's laws, we know that all vortexes have to either close on themselves,
terminate at a solid boundary, or taper to a point.213 But the
sharp upward turn of the inflow means that all of a sudden, all of the magnetic
lines of force resolve into a unified field surrounding the surface inflow. And this
is precisely the point at which the water molecules begin condensing.
It's also possible that the shelf clouds that appear encircling the main rain area
are a related phenomena, though the moving charges responsible would be simply the
rain itself. (See Scott Blair's shelf cloud page for more
examples.)
Figure 144. Shelf cloud in Enschede, The Netherlands, 2004-07-17, courtesy John Kerstholt.
One aspect of supercells that has never been addressed by any EM theory is the
development of mammatus clouds. While these forms are of little general interest to
meteorologists, because they occur late in the cycle of a thunderstorm (and
therefore offer no predictive value), and because they don't pose any risk, they are
nevertheless distinctive phenomena that deserve explanation.
Mammatus clouds are rounded forms that appear under the anvil of a severe
thunderstorm as it dissipates. (For more mammatus photography, see
Jorn Olsen's "cloudscapes" page, or
this page on the Environmental Graffiti site.) The lobes tend
toward consistency in size, and while sometimes the arrangement is nearly random,
sometimes the lobes occur in linear patterns. The individual lobes last about 10
minutes before evaporating, but a formation of them can sometimes persist for a
couple of hours.214
See the Wikipedia article for a good description of the
leading theories on mammatus cloud formation, and for the reasons why they are
considered adequate.
Figure 147. Mammatus clouds over Kansas, 2008-06-12, courtesy 3D King.
To understand what causes mammatus clouds, we should first consider the context in
which they occur. In the late stage of a thunderstorm, the updraft has expired, and
downdrafts dominate. At this point, the airflow in the anvil switches direction,
from its outward expansion driven by the updraft, to inward contraction toward the
void left by the downdrafts at the top of the cloud.
In this context, we can understand the linear organization of the mammatus clouds.
While the updraft was still forcing air into the anvil, the flow was turbulent, and
long, straight cloud features were not possible. But when the airflow reverses
direction, and downdrafts are pulling the anvil back toward the center of the storm,
the airflow is laminar, and in this condition, linear structures can emerge.
The next question is: what is responsible for getting the laminar flow to resolve
into distinct bands? The quick answer is that nobody knows, but the EMHD model
suggests a possibility. We know that the anvil is storing an enormous amount of
positive charge, and we know that charged gases have a lower viscosity. So while
electrostatic repulsion tends to disperse the charges, in motion the more
highly charged parcels flow faster. So we can expect streams of charged particles
flowing through neutral surroundings. The two forces together then result in a
series of equally spaced bands. Electrostatic repulsion limits the amount of charge
in each band, and distributes the bands evenly, while the reduction in viscosity
organizes the flows.
Then the question is: what is causing the water vapor to condense? Here, again, the
quick answer is that nobody knows. The reduction in pressure in the anvil also
reduces the temperature, and this encourages condensation. But condensation isn't
going to cause a falling parcel of air that would become a mammatus lobe
— condensation causes updrafts, due to the release of latent heat.
And though the lobes look like drops of water on a ceiling that are ready to fall,
such is not their nature. Rather, the lobes simply dissolve after 10~15 minutes.
And here again the EMHD model offers a suggestion. In the reduced pressure after the
airflow in the anvil switches direction, we would otherwise expect more condensation
in the anvil. But we also know that the anvil is positively charged. So
electrostatic repulsion will prevent the aggregation of water molecules. We also
know that there is a powerful electric field between the positively charged anvil
and an induced negative charge in the Earth. This could pull the more highly charged
parcels downward, and there could also be a flow of electrons upward in this field.
As depicted in Figure 148, the lines of electric force will
approach a positively charged falling parcel from every direction. Electrons
entering the parcel will neutralize the positive charge. Without any electrostatic
repulsion, if the air is below the dew point, the water vapor will condense. And the
form of this condensation will be spherical. In other words, the lobes are the
anodes in an electric field between the ground and the cloud, and the visible aspect
of the lobes reveals the arrival of electrons.
Figure 148. Positive charges (green) over a conductor with an induced negative charge (red). The white lines represent the highest field density. Electrostatics applet by Paul Falstad.
So the possibility is that an electric current flowing upward from the ground
enables condensation, especially in the parcels that have the most charge. The
condensation process then releases latent heat, and the parcel is sent upward,
leaving the hemispherical form at the bottom to simply dissolve.
Now we can look back at the images of this phenomenon, and resolve the remaining
anomaly. Intuitively, we would expect the anvil to be opaque with condensation, with
the mammatus lobes just being the side of the anvil that is facing us on the ground.
But in the images, we can clearly see that there is no condensation above. The
condensation is, in fact, a very thin boundary condition. Above the
boundary, the air is super-saturated with water vapor that cannot condense because
of its charge. At the boundary, electrons from below enable condensation, which
falls out of the anvil and evaporates again in the drier air below the anvil. And
the parcel that released the condensation is sent back up into the clear air above.
In the extreme poverty of data on the conditions within mammatus clouds, there is
little to constrain the speculation, and the contentions in this section are purely
conjectural. Nevertheless, the photographic evidence constitutes a challenge for any
theoretical candidate, and it's appropriate to demonstrate that the EMHD model can
at least suggest an explanation that's possible, while the standard model
cannot.
"Waterspout" is an ambiguous term in meteorology, but most commonly, it refers to a
vortex that was formed by a non-mesocyclonic thunderstorm over water, and the term
"landspout" refers to a similar vortex over land. These are sometimes called "fair
weather" vortexes, but that's a bit of a misnomer — they still require the
presence of a thunderstorm. 'Spouts account for 20% of the vortexes that are
reported as tornadoes.54
Some researchers consider 'spouts not to be tornadoes at all, but rather, some other type of
vortex, and not even worth studying. It is certainly true that mesocyclonic storms are
responsible for almost all of the EF2+ tornadoes. Because of that important causal
relationship, the standard probabilistic model is built around the mesocyclone, leaving no
place to put data collected from 'spouts. But a detailed analysis of the physics that causes
these vortexes doesn't have the same problem, and the flow fields in non-mesocyclonic
vortexes are definitely tornadic.215 The inflow hugs the surface of the
Earth from over 1 km away, in spite of the skin friction, and the lowest
pressure is at the surface, as far as it can get from the source source of the low pressure
inside the storm. 'Spouts tend toward the "stovepipe" form, and typically have a dust sheath
(or aerosol sheath over the water). But these characteristics can be present in mesocyclonic
tornadoes as well. So the EMHD model considers these vortexes to be of the same type as
tornadoes, and they require the same explanation. And they are definitely worth studying.
Mechanistically speaking, in no sense can a rotating updraft 1 km above
the surface be responsible for tornadic wind speeds at the surface. If we are to fully
understand tornadoes (including those that do descend from mesocyclones), we have
to understand the actual forces responsible for them, and non-mesocyclonic vortexes better
isolate those forces. We can then investigate how mesocyclones, in addition to their
incidental rotation, also develop larger quantities of such forces. From an operational
forecasting perspective, we might still place a great deal of emphasis on the mesocyclone.
But we might also gain the ability to predict non-mesocyclonic tornadoes, which are
responsible for 2⁄3 of the unwarned events, and to overlook the
mesocyclones lacking the forces necessary for tornadoes, which are responsible for 9⁄10 of the false alarms.33,54 Without this factoring
exercise, such improvements in forecasting will not be possible.
The section entitled "A New Hypothesis"
proposed that the essential ingredients for a tornado are a solid conductor at the
bottom, positively charged inflow, and an electric current inside the vortex.
Conspicuously absent is the necessity of an updraft in the cloud, much less a
rotating one. The sense in which an updraft aloft is significant (especially if it's
rotating) is that the lower pressure (especially in the core of a vortex) also
lowers the electrical resistance, opening up a conduit for the flow of electrons,
and thereby initiating the tornadic process. But it wouldn't necessarily have to be
a thunderstorm updraft or a mesocyclonic vortex. Any random gust at a downdraft
outflow boundary might create a small vortex that might open up a conduit for an
electric current, and then the tornadic feedback loop might take hold.
This suggests that tornadoes should occur all of the time. So what is the
rare factor? That would be the presence of warm, positively charged air at
the ground (which is typical at the end of the thunderstorm), while there is still a
lot of negative charge in the cloud, especially if there is still a powerful
updraft. In other words, a long-lived thunderstorm is more likely to spawn a
tornado. In a normal thunderstorm, the downdrafts undercut and extinguish the
updraft. So at the end of the cycle, there might be a strong positive charge near
the ground, but at that point, the bulk of the negatively charged precipitation has
already fallen out of the cloud, and there is no updraft (much less a rotating one)
to serve as a conduit for an electric current. So only those storm
structures that are capable of sustaining the updraft and the downdrafts, and of
keeping the negative charges suspended in recirculation patterns, long enough for
all of the pieces to come into play, will be capable of spawning tornadoes.
The mesocyclonic storm structure has already been described in detail. Another
structure capable of spawning tornadoes is the cylindrical airflow in a squall
line.216 Like any thunderstorm, a squall line manufactures
precipitation inside the updraft. At the top of the cloud, gravity and terminal
velocity sort out the particles, with heavier precipitation falling first, and
therefore taking the inside track, while the positively charged ice crystals are
trapped in the air from which they condensed. Once the charges have been separated,
it's possible that the electric force establishes a positive double-layer enveloping
the negative inner core. This would get positively charged air down to the surface,
where it could stick to the surface and set the stage for a bottleneck discharge
vortex.
Figure 149. Possible EM structure of a vortex-producing squall line.
Figure 150. Line of waterspouts off the coast of Albania, 1999-08-01, courtesy Roberto Giudici.
Note that the tornadoes that sometimes occur behind squall lines are more
typically supercellular. Behind the line, warm inflow to the squall is topped by
cool air displaced by the anvil, and this sets up the wind shear and convective
potential that could result in a cumulonimbus cloud that could become mesocyclonic.
In the case of a tornado associated with an isolated thunderstorm that is not part
of a squall line, and that is not mesocyclonic, it's possible that the recirculation
is simply toroidal (without the mesocyclonic twist), as depicted in Figure 1.
In cases where extremely robust mesocyclones develop, but that do not produce
tornadoes, the EMHD model contends that there may have been a well-developed
negative charge stream inside the storm, but there was not enough charge in the
positive double-layer to support a tornado.
Dust devils are definitely different from tornadoes, as they occur completely outside the
context of thunderstorms, and in fact require that there be little to no cloud cover at all.
So there is no electric current flowing down through the vortex, and there is no release of
latent heat due to condensation in the vortex wall. (In Figure 151, the
vortex is white just because that's the color of the dust on the ground.) And in the absence
of a thunderstorm, the charge separation mechanism is very different. But like a tornado,
the fuel source is a shallow layer of hot, low-viscosity, charged air clinging to the ground
because of the electric force. And like the debris cloud in a tornado, the charged air in a
dust devil gets neutralized by lofted dust, releasing the air from its attraction to the
ground, and thereby enabling the updraft. Dust devils are not of interest to meteorologists,
as these extremely weak vortexes almost never cause fatalities. But they do have a few
things in common with tornadoes, and studying dust devils allows us to see some of the same
forces operating in a very different environment.
Figure 151. Dust devil in Saltillo, Coahuila, Mexico, 2008-03-10, courtesy Dupondt. Click the image to watch the associated video.
On a cool, sunny day, the Sun heats the surface of the Earth, and the heat radiates
into the air. Normally hot air rises, but in the conditions that form dust devils,
the hot air defies its buoyancy and clings to the ground instead. (The temperature
gradient can be so great that mirages become possible, where light waves are
refracted by the difference in density between the hot air and the cooler air just
above it.) So how can hot, buoyant air cling to the ground, topped by cooler, denser
air, without convection distributing the heat?
The only possible explanation for hot air not rising is that another force is
present, and the only other force present in the atmosphere is electromagnetism.
Since air is not responsive to the magnetic force, the only possibility is that it's
the electric force. We therefore know that an electrostatic attraction pulls the air
down to the Earth, and with more force than the buoyancy that pushes it up. For this
to be true, there has to be a charge separation process, resulting in the air and
the Earth being oppositely charged. Then the question is: what is separating the
charges?
It is well known that photons can ionize molecules. So when photons impact the soil,
some of the electrons are excited to an energy level that liberates them from the
molecules. Of those, the ones heading upward will then get captured by air
molecules, developing a negative space charge in the air. Then there will be an
attractive force between the negatively charged air and the positively charged
ground.
Ordinarily, we would think that the conductivity of the Earth should preclude
ionization. The only electrons that will be liberated will be from the topmost
molecules, and these should be easily replenished from the vast electron cloud of
the Earth. But if the surface of the Earth is getting ionized, it solves
another riddle. Dust devils are most likely to occur over poorly-conductive soils,
such as sand in a desert. In the present context, it's easy to understand why. Poor
conductivity is a necessary condition if there is to be a charge separation due to
ionization — otherwise, missing electrons in the soil will be quickly replaced
from the underlying molecules, and any net charge that might develop in the air will
be dispersed by electrostatic repulsion. So a charge separation between the air and
the Earth is possible under these conditions. And if the electric force
offsets the buoyancy of the hot air, enough thermal energy can accumulate to power a
dust devil.
Considering the fact that the electric force is 39 orders of magnitude more powerful
than gravity (which is the fundamental force responsible for cool, dense air falling
and for hot air, with less density, rising), we would then wonder why an updraft
would ever become possible at all. The electrostatic potential should prevent the
hot air from rising, until the Sun goes down and the ionization process stops, at
which time the opposite charges will recombine faster than they are getting created.
Yet there is a limit to how strongly ionized the surface of the Earth can become.
Incoming EM waves can liberate weakly-bound electrons from molecules directly
exposed to the sunlight, but once a net ionization has developed across the surface
of the Earth, the electric force will prevent the escape of electrons into the air.
This limits the amount of space charge that can develop. Yet the temperature of the
air can continue to increase. If the buoyancy of the hot air overpowers its
electrostatic attraction to the ground, a small parcel of air will break away,
ascending to an altitude appropriate for its low density. As the electric force
falls off with the square of the distance, the rising parcel will experience less
downward force the higher it goes.
The vacuum created at the surface by the first rising parcel will be filled by air
sliding along the ground, still bound by the electric force, yet responding
horizontally to the low pressure. Once the lateral inflow achieves the point at
which the first parcel rose, the low pressure aloft, combined with the parcel's
buoyancy, overpowers the electric force, allowing the convergent inflow to rise as
well. So the first rising parcel triggers a continuous flow of air along the ground
and then upward at the point of convergence.
Since the hot air layer is so shallow, we might think that the updraft will quickly
run out of thermal energy in its immediate vicinity. If cool air from above is drawn
in, the updraft will fail. But charged air has a lower viscosity, because
electrostatic repulsion prevents the particle collisions that instantiate
friction.25,26,27 So the ionized air will flow more easily than the
cool, neutrally charged air above it. Hence the vacuum near the ground will be
filled with more hot air, even if the hot air has to travel a greater distance than
cool air from above. This creates the possibility of hot air from a broad area
flowing along the ground to get into a single, organized updraft.
If the updraft is stationary, its intensity and duration are limited by the distance
from which hot air can be drawn, with its friction still being lower than the
friction of drawing in higher-viscosity air from above. If the terrain is flat and
smooth, we can expect the effective inflow to come from further away, as skin
friction will result in boundary vortexes that will be relatively small, and
turbulence will not reach the full depth of the hot air layer. Hence the laminar
flow in the hot air layer will present little friction. Rougher surface conditions
will reduce the effective inflow radius of the updraft.
If the updraft can get more hot air from one direction than from another, it will
move in that direction, and instead of the air moving to the updraft, the updraft
will move to the air that can rise. This removes the restriction on the duration of
the updraft. Regardless, the intensity of the updraft is still limited by the rate
at which it can pull air from the hot air layer without pulling in cool air from
above.
If the converging lines of motion are not perfectly radial, a spiraling inflow
pattern will emerge, and the updraft will become a vortex. The direction of the
rotation is random, and it is common for both cyclonic and anti-cyclonic dust devils
to occur in the same area, with the same conditions. It is also possible for the
same dust devil to switch directions and continue on. This is true in both the
northern and southern hemispheres of the Earth. Hence there is no reason to believe
that the rotation is being encouraged by the Coriolis effect, or by Lorentz force
acceleration, both of which would prefer one direction over another, and which would
be hemisphere-specific.
If the air moves fast enough, it will start to kick up dust at the surface. The dust
has the charge of the Earth. When mixed with the oppositely charged air, the net
charge of the hot air becomes zero, completely freeing the air from its
electrostatic attraction to the Earth. Hence the dusty air will rise far more
vigorously than the clear air that initiated the process. This explains the rapid
intensification in the instant that the dust devil becomes visible due to airborne
particulate matter.
The corollary also appears to be true, that while the presence of dust might help
free the space charge from its attraction to the ground, the space charge might be
responsible for hoisting far more dust into the atmosphere than would be predicted
simply on the basis of wind speeds and durations.217,218
The charge separation mechanism (ionization from sunlight), combined with the
consolidated convection, accounts for the huge voltages detected in dust devils. The
10 kV/m potentials that have been measured are typically
attributed to triboelectric charging from particle collisions within the vortex, but
this doesn't explain why there would be any triboelectric charging at all when
particles of similar constitution collide, nor why there would be that many
collisions anyway in the laminar inflow to a vortex, nor why other vortexes of
similar intensity (such as gustnadoes) do not develop similar potentials.
It is not likely that the reduced pressure inside the vortex (which will lower the
electrical resistance of the air) will result in any significant "fair weather
current" in the presence of the fair weather electric field (100 V/m), as some have
contended. It is also not likely that at the distances and speeds in question, there
is any significant increase in temperature due to skin friction.
As concerns dust devils on Mars, the question is not so much a matter of how a
temperature inversion occurred, with a layer of hot CO2 under cool
CO2, and where the total buoyancy, if all consolidated into a vortex,
could create a dust devil. Rather, the first and biggest question is how that much
work could be performed at all in an atmosphere that is so thin. This can be
answered with the same mechanism. A charge separation, instantiating an electric
field, could create a space charge in which the atmospheric pressure is far greater
than normal. Then, if surface heating increases the buoyancy beyond that which can
be contained by the electric force, an updraft occurs. In these conditions, there is
no cooler layer above the hot layer, so the intensity of the dust devil is not
limited to how fast it can pull in hot CO2 without pulling in cool
CO2 from above as well, extinguishing itself in the process. Hence dust
devils of great size and speed become possible.
Positing the existence of a major charge separation that gets neutralized by the
mixing of charged CO2 with oppositely charge dust also explains the
flashes that have been observed at the base of Martian dust devils. Heat from the
discharges might also contribute to the buoyancy of the updraft, though there's no
reason to suspect that this is a necessary condition.
Figure 152. Dust devil on Mars, taken by rover Spirit on sol 486, courtesy NASA.
A curious cross between a tornado and a dust devil is pictured in Figures 153~155. These vortexes are tornadic in two
significant respects: 1) the vortexes expand in the direction of the flow, and
2) there are "debris funnels" originating from the mouth of the vortexes. In
previous sections, both of these behaviors were shown to defy the principles of
fluid dynamics.
Figure 153. Suction vortex between a jet engine and the ground, courtesy Derek Ferguson.
Figure 159 shows a CFD simulation, which succeeded in getting
vortexes in the inflow, but (of course) could not reproduce the expansion in the
direction of the flow, nor the debris funnels, which fluid dynamics does not
allow. These characteristics are displayed consistently in tornadoes, indicating
the presence of another force, which can only be electromagnetism.
Because the vortex expands in the direction of the flow, we know that there is a bottleneck
with an extreme low pressure at the ground. Only an electric force between the air and the
ground could create such a bottleneck in the flow. Outside of the context of a thunderstorm,
we have no reason to suspect that the air could have a strong positive charge. And since
asphalt is an insulator,219 the ground wouldn't support much of an induced
charge anyway. So we can suspect that the charging mechanism is photo-ionization on the
surface of an insulator, as it is in dust devils, and that the air is negatively charged,
having absorbed the electrons liberated from the asphalt. Once an electric field between the
air and the ground is instantiated, the air can be heated above its thermodynamic
equilibrium without rising, because the electric force offsets the buoyancy. In other words,
there is a temperature inversion, with hotter air at the surface that refuses to rise,
topped by cooler air just above it that cannot fall. (This explains why asphalt is famous
for producing mirages.)
Now we just need a charge neutralization mechanism, to release the air from its attraction
to the ground, enabling ascension into the vortex.
Here we can definitely rule out neutralization by lofted dust/debris. Runways used by jets
have to be kept perfectly clean, as anything lofted into the engines will destroy them. And
there cannot be any telluric currents through the poorly conducting asphalt. So the
neutralization can only occur as a result of an electric current through the vortex, as it
would in a tornado. But unlike a tornado, the electrons must flow upward through
the vortex, as the charge that needs to be neutralized is negative. The electromotive force
would be an attraction to the positively charged jet engine exhaust, with the low pressure
in the vortex serving as the low-resistance conduit.
Once neutralized, the moist air clinging to the tarmac is free to condense, and the vortex
becomes visible. Premature neutralization even supports a "debris funnel" that seems to be
outflow from the mouth of the vortex, but as in a tornado, is just powerfully buoyant air
that has been released from its electrostatic attraction to the ground before it gets into
the vortex, and rises out of the inflow. From there, the "debris funnel" seems to be only
weakly affected by the low pressure at the mouth of the engine, as the aspect of it that is
forward of the engine does get sucked in, but some of it appears to stagnate aft of
the intake, and to the sides of it. This is analogous to the fast flow in a tornado, within
the larger context of air moving slowly into a mesocyclone. Needless to say, the inboard
engine is not at full throttle, or the "debris funnel" would be drawn straight into the
engine, and the outboard engine might be idling.
So this vortex has the lower boundary and polarity of a dust devil, but with a secondary low
pressure "aloft" that a dust devil does not have, and with a neutralizing current flowing
through the vortex, producing a distinctly tornadic form. Of all of the photography and
videography that was reviewed in the preparation of this paper, this is the only vortex that
can truly be called tornadic that was not produced by a thunderstorm. All of the other
so-called "tornado simulators" shown in the section entitled "Lab Suction Vortexes" are simple suction vortexes that contract with
proximity to the source of the low pressure, and are incapable of developing "debris
funnels" in split flow fields.
On May 25, 1955, a supercell spawned two F5 tornadoes, one that damaged Blackwell,
OK, and the other that destroyed Udall, KS. This storm displayed extremely robust EM
properties, and because of this, a number of EM theories of tornadogenesis emerged.
Unfortunately, in the 1950s so little was known about tornadoes that there was
nothing to constrain the speculation, and the theoretical work yielded little
lasting value.
With far more information, and with a theoretical framework that can now explain a
wide variety of tornadic properties, we can revisit the first-hand observations made
by a trained weather observer on that day, to see if the theory in question can
explain even the most extreme of cases.
Figure 157. Diagram of Blackwell-Udall tornado, 1955-05-25, courtesy Floyd Montgomery.
The following properties in the diagram are explained by the EMHD model:
the expansion of the vortex in the direction of the flow, without pulling in
any air above the surface (as proved by the persistent scud clouds near the
top of the tornado, that should have been drawn in rapidly if there was any
upper-level inflow),
the fact that the condensation funnel was baseless (the air had too much
positive charge to condense),
the presence of St. Elmo's Fire (there was a strong positive charge above
the surface), and
the blue light being emitted at the tornado/mesocyclone interface (the
positive charge was getting neutralized by a flow of electrons down from the
cloud).
In addition to what is show in the diagram, other reports include:
an "electrical" smell (ozone, evidence of ionization), and
difficulty breathing (high-pressure air with a strong positive charge).
In other words, the EMHD model explains all of the anomalous aspects of the
phenomenon.
It's instructive to note the results of electric field measurements made on the same
storm, and the characteristic interpretation of those results at the
time.116
At the time of the passage of the funnel near [within 5 km of]
one observing station, the surface electric field fluctuations became relatively
quite small and the electric field density approximated
0.4 kV/m. There is little evidence suggesting that the
electrical effects near the funnel differ basically from normal thunderstorm
electrification.
Small electric field fluctuations, and extremely low electric field densities,
actually differ radically from normal thunderstorm electrification. And St.
Elmo's Fire occurring in an electric field measuring 0.4 kV/m is not physically possible. (The pressure would have to be so low that there
wouldn't be enough molecules present to create the observed luminescence.) The
dismissal of the data was simply the researcher's reaction to that which he could
not explain. The inexplicable lack of electric field would later become known as the
"lightning hole," and remains inexplicable to this day outside the context of the
EMHD model. And the glow discharge that was observed had to be the result of a
concentration of electric charge near the vortex.
Having considered a wide variety of phenomena produced by supercell thunderstorms,
we must also remember that all of these properties are caused by a finite number of
forces. Therefore, the various forms are products of differences in the balances of
forces present, and it would be useful to attempt to classify the distinctive forms
on the basis of the strengths of the forces. Then the hypothesis in question can be
further challenged by comparing the asserted balance of forces with the in
situ data.
Table 4. Balance of Forces Responsible for Different
Properties
Green Thunderstorm
negatively charged precipitation loses electrons to the
positively charged air under the cloud, resulting in photon
emissions
should only be possible in an inverted polarity storm,
where there is a positive charge "aloft" (as measured from
the ground) with the main negative charge region above it
Beaver's Tail
inverted temperature/humidity gradient — warm, dry
air nearer the ground, topped by cool, moist air
requires inverted polarity storm
lots of negative charge in mesocyclone flowing through
tube
Cloud-base Striations
large amount of charge flowing down from cloud, into air
and opposite charge in ground
high-humidity air
insufficient angular momentum to generate vortex
Funnel or Stovepipe
strong positive charge in air clinging to ground
moderate electron flow down from cloud
moderate inflow to mesocyclone
Vortex Breakdown Above Ground
more extreme energy release at surface resulting in
higher swirl ratio
weak inflow to mesocyclone
Vortex Breakdown at Ground
even stronger positive charge in air clinging to ground,
resulting in even higher swirl ratio
weak inflow to mesocyclone
Shrouded in Turbulence
even stronger positive charge in air clinging to ground,
resulting in even higher swirl ratio
weak inflow to mesocyclone
Wedge
extremely strong positive charge in air clinging to
ground
massive negative charge in cloud flowing toward ground
extremely robust inflow to mesocyclone
Baseless Vortex
high conductivity in Earth and/or strong positive charge
in air
powerful updraft
Condensation Only at Surface
weak positive charge and/or low conductivity in Earth
only occurs in the seconds before the vortex falls apart
Now we should begin to consider the actual prospects for EMHD within the
meteorological community. NSSL states that "as far as
scientists understand, tornadoes are formed and sustained by a purely thermodynamic
process." That's actually an understatement. They could have added, "and we don't
see that changing." The following quote is from a relatively recent paper
co-authored by the director of NWS's Storm Prediction Center.220 The authors recount wild stories from the tornadic lore, many of which are a
bit incredulous, but they only discredit the accounts of unusual EM phenomena. They
further contend that such phenomena are only to be found in the lore, and
are not to be taken seriously.
As our knowledge of tornadoes has increased, so has the quality of our observation.
Many early accounts of tornadoes are filled with what today we would consider
curious, or even false, observations of "electric" or "fiery" tornadoes. These
strange accounts led many noted researchers to speculate that tornadoes were
inherently electrical phenomena.
Indeed, for many years, the noted meteorologist Bernard Vonnegut was one of the
leading advocates of a link between tornadoes and electricity. For instance, he
described a 1965 Ohio tornado as having a "beautiful electric blue light" and a
"ball of orange lightning [that] came from the cone point of the tornado." A classic
description by weather observer Floyd Montgomery of a "luminous" tornado in 1955
appeared in the June 1956 issue of Weatherwise. "As the storm was directly east of
me, the fire up near the top of the funnel looked like a child's Fourth of July pin
wheel.... As near as I can explain, I would say it was the same color as an electric
arc welder but much brighter, and it seemed to be turning to the right like a beacon
lamp on a lighthouse."
Even earlier accounts attempted to link tornadoes and electricity using damage
assessment. Nineteenth-century meteorologist Robert Hare, for example, claimed that
the "parched and scorched" nature of the vegetation following a 1835 New Jersey
tornado conclusively proved that electricity is fundamental to tornado formation.
However, with the advent of cameras, video-cameras, lightning-detection equipment,
and other sophisticated meteorological instruments over the last 50 years, we now
find that tornadoes do not demonstrate marked electrical activity. Research into the
"electrical nature" of tornadoes has faded away. The question that must be asked
(but unfortunately can't be answered) is, why did all those early accounts mention
"luminous" tornadoes? Did they see something that we don't see today? Or was it
self-fulfilling prophecy — people expected to see fiery tornadoes, and so they
did?
The authors knew that tornadic luminosity has been captured with cameras and
video-cameras, as some of the evidence is in the one of the papers that they quote (unless
they didn't look at the pictures).157 They should have known that
lightning-detection equipment has detected marked changes in electrical activity
during the tornadic phase of thunderstorms, as one of the Storm Prediction Center's
initiatives is to predict tornadoes on the basis of lightning patterns (unless the Director
didn't expect to see that in the budget, and so he didn't).117,118,119,120,221 They also should have known that "other sophisticated meteorological instruments" have
detected powerful magnetic fields30,112,113,114 and telluric currents.112,180 So why did they dismiss the instrumented data? Then the authors attempted
to discredit the eyewitnesses. Are we really to believe that the dozens of NASA scientists
who observed the tornado in Huntsville, AL in 1974211 all wrote false
reports, because they "expected to see a fiery tornado"? And did their film expect to be
exposed to a fiery tornado?
The question that really must be asked is why did all those modern
authorities ignore the instrumented data and the credible eyewitnesses?
To understand the official stance against electric tornado theory, we have to see it
in the context of the history of tornado research. The modern scientific study of
tornadoes began with a classical thermodynamic approach in the 1950s. By the end of
that decade, scientists already knew that tornadoes were not simple suction
vortexes. Through the 1960s, a number of EM hypotheses were considered. But after 20
years of research, it became clear to everybody that they just weren't making any
progress. So in the early 1970s, the physics funding got cut, and a new strategy
emerged. If the objective is to predict tornadoes, then by the time they
spin up, it's already too late. So we actually need to forget about why tornadoes
behave precisely as they do, and instead, we should be looking at the preconditions
that result in tornadoes. This means focusing just on the original source
of the energy in thunderstorms, which takes us above the storm scale, and into the
study of air mass collisions, wind shear, etc. (Note that above the storm scale,
electromagnetism is not a big factor, so this shift in granularity took it out of
the picture.) And due to the poverty of data at that scale, and the
processor-intensive nature of the Navier-Stokes equations, operational weather
forecasting is not mechanistic physics — it's probabilistics. Take the data
collected by the weather balloons, interpolate between the collection points to
estimate temperatures, pressures, wind vectors, etc., throughout the area of
interest, and then look for recognizable patterns in the way everything is moving
that will yield predictive value. If possible, quantify the causal relationships,
such that whenever the preconditions are present, a numeric probability of the
outcome can be generated.
Not having actually worked out the physics of tornadoes, in the mid-1970s
meteorologists filled the void with a probabilistic model (as described in the
section entitled "Thermodynamic Supercells?").
Because of the causal relationship between mesocyclones and tornadoes (especially
the most powerful ones), the model simply extends the mesocyclonic rotation down to
the ground to make a tornado. Even though it defies physics, this at least provides
the framework for associating preconditions and outcomes, enabling
numerically derived tornado forecasts with accuracy well above chance.
As concerns the evidence of unusual EM activity in tornadic storms, the only way
that researchers can defend their funding is to deny that they're missing something,
and to discredit those who attempt to call their attention to the oversight. In this
context, it's not surprising to hear a ranking government official stating that
"tornadoes do not demonstrate marked electrical activity," in spite of the evidence.
The funding for electric tornado theory was cut in the early 1970s. If they can't
get funding for probabilistic modeling, they can't get any funding at all. So the
best thing for society is to suppress the evidence that tornadoes are
electromagnetic. It was tough at first, but the passage of 40 years has made it
easier. Now they can say that unusual EM activity in tornadic storms is only to be
found in the historical literature from more than 40 years ago. It's axiomatic that
modern instruments don't detect such things, because there isn't any modern funding.
Anybody who doesn't know this can be led to believe that the historical reports are
simply not up to modern standards.
So now, thunderstorms are purely thermodynamic. For example, in 2009~2010
meteorologists spent $12 million on VORTEX2, the most
ambitious tornado field study in history. The following is an impressive overview of
the instrumentation that was deployed.
VORTEX2 used an unprecedented fleet of cutting edge instruments to literally
surround tornadoes and the supercell thunderstorms that form them. An armada of 10
mobile radars, including the Doppler On Wheels (DOW) from the Center for Severe
Weather Research (CSWR), SMART-Radars from the University of Oklahoma, the NOXP
radar from the National Severe Storms Laboratory (NSSL), radars from the University
of Massachusetts, the Office of Naval Research, and Texas Tech University (TTU), 12
mobile mesonet instrumented vehicles from NSSL and CSWR, 38 deployable instruments
including Sticknets (TTU), Tornado-Pods (CSWR), 4 disdrometers from the University
of Colorado (CU), weather balloon launching vans (NSSL, NCAR and SUNY-Oswego),
unmanned aircraft (CU), damage survey teams (CSWR, Lyndon State College, NCAR), and
photogrammetry teams (Lyndon State University, CSWR and NCAR), and other instruments
were deployed.
In all of that, there wasn't one single electric field meter or magnetometer. No
study of a thunderstorm would be complete without at least one measurement
of the degree of electrification — unless of course the storm spawns a
tornado, in which case the structure and dynamics of the system become purely
thermodynamic?
Unfortunately, neglecting key data guaranteed that meteorologists would hit the wall before
crossing the finish line, and such is now the case. Only 1⁄4 of all
mesocyclones produce tornadoes,54 and even with in situ
data, supercells that produce tornadoes are difficult to distinguish from those that
do not.33 Furthermore, some of the most powerful mesocyclones on
record did not produce tornadoes,98,99 while 20% of all tornadoes
descend from thunderstorms that aren't rotating.54 Since
meteorologists only look for mesocyclones when assessing the risk of tornadoes, the
non-tornadic mesocyclones generate false alarms, and the non-mesocyclonic tornadoes
strike without warning. With the existing model, those statistics will never
improve.
So how are we to proceed?
To a physicist, this would be easy to answer. No CFD or laboratory simulation using
realistic conditions has ever produced a tornadic vortex, and with good reason
— the principles of thermodynamics preclude it. In a rigorous discipline, this
would constitute proof of the presence of another force. In the atmosphere, that
other force can only be electromagnetism. In the 1960s, electromagnetism alone was
shown to be inadequate for tornadogenesis. There is only one other possibility
— tornadoes result from a combination of electromagnetic and
thermodynamic factors. Some exploration in this direction has been done in the last
40 years, such as the work that Vonnegut and others did with discharge
vortexes.108,109,110,222,223 Progress has been slow, due to a lack of
funding, and because of the novelty of the approach. But in recent years, EMHD has
come a long way, and now has a broad body of generalized principles that are being
applied to a wide range of problems.70 Some scientists are
becoming of the opinion that all of the natural mysteries that have not
already surrendered to either Newtonian or Maxwellian physics will, by
definition, one day surrender only to a combination of Newtonian and
Maxwellian physics. So the enigmatic nature of tornadoes is precisely the type of
problem that calls for such an interdisciplinary approach.
But meteorology isn't a rigorous discipline. The paradigm shift in the early 1970s,
from mechanistics to probabilistics, didn't just de-emphasize physics. It changed
the way meteorologists think about physics. "Thermodynamics" has become a very
loose, flexible framework that can be adapted easily to explain just about anything,
and in no sense is it constrained to physical laws.
If that sounded incredulous, consider the following abstract from a recent work
published in a prestigious journal that extends the meteorological model of
mesocyclones to explain volcanic plumes.224
A strong volcanic plume consists of a vertical column of hot gases and dust topped
with a horizontal 'umbrella'. The column rises, buoyed by entrained and heated
ambient air, reaches the neutral-buoyancy level, then spreads radially to form the
umbrella. In classical models of strong volcanic plumes, the plume is assumed to
remain always axisymmetric and non-rotating.
Here we show that the updraught of the rising column induces a hydrodynamic effect
not addressed to date — a 'volcanic mesocyclone'. This volcanic mesocyclone
sets the entire plume rotating about its axis, as confirmed by an unprecedented
analysis of satellite images from the 1991 eruption of Mount Pinatubo. Destabilized
by the rotation, the umbrella loses axial symmetry and becomes lobate in plan view,
in accord with satellite records of recent eruptions on Mounts Pinatubo, Manam,
Reventador, Okmok, Chaitén and Ruang. The volcanic mesocyclone spawns
waterspouts or dust devils, as seen in numerous eruptions, and groups the electric
charges about the plume to form the 'lightning sheath' that was so prominent in the
recent eruption of Mount Chaitén. The concept of a volcanic mesocyclone
provides a unified explanation for a disparate set of poorly understood phenomena in
strong volcanic plumes.
In mechanistic terms, all of the statements in their second paragraph are false.
Of all of the volcanoes studied (Pinatubo, Manam, Reventador, Okmok, Chaitén
and Ruang), only the satellite imagery from Pinatubo actually showed any rotation in
the umbrella — the others did not. As there isn't any way for an umbrella to
rotate fast enough to become unstable without the rotation being apparent in the
satellite imagery, the contention that umbrella rotation is an intrinsic property of
volcanic plumes is false.
That leaves open the question of what caused the rotation at Pinatubo. The authors
contended that it was boundary vortex tilting and stretching.
In reality, two small, counter-rotating vortexes do not combine into one big vortex
— they cancel each other out — so that doesn't explain anything. The
actual reason for the rotation at Pinatubo is that in an unprecedented coincidence
of catastrophes, the umbrella absorbed the impact of Typhoon Yunya, which then
relaxed from a tropical cyclone to a tropical storm.225,226 As the
angular momentum of a typhoon is real, there is no need to invoke artificial
contrivances like vortex tilting and stretching.
Figure 159. The umbrella above Mount Pinatubo (marked with a yellow X), 1991-06-15, 08:40 UTC, courtesy USGS. The approximate position of Yunya at the time of the image is marked with a red cross.
Furthermore, a mesocyclone does not "group the electric charges about the [updraft]
to form a 'lightning sheath'." In fact, it does the exact opposite — it forms
the core of the lightning hole. The lightning in a supercell is primarily in the
downdrafts (which volcanoes do not have) around the outside of the storm. The
charge separation in a volcanic column actually begins with
triboelectric charging inside the subterranean vents, and lightning is possible even
at the mouth of the vents.227 So explaining volcanic column
electrification with a mesocyclone metaphor is just not correct.
Lastly, to think that the slow rotation of an umbrella in the stratosphere is
somehow connected to the fast rotation in a tornado at the surface of the Earth,
when the tornado is separated from the umbrella by over 10 km of
non-rotating air, is just not possible. Indeed, the plume in Figures 160 and 161, which is too weak to create an
umbrella, and which is not rotating, nevertheless displays strong electrification
and two tornadoes. It's clear that in volcanoes, and in thunderstorms, tornadoes can
be correlated directly to the electric force, and not to updraft rotation.
Still, the authors were confident that they had achieved a "unified explanation for
a disparate set of poorly understood phenomena"? Actually, they merely achieved a
careless dismissal of a few bothersome anomalies, and this was sufficient
scholarship in atmospheric thermodynamics to get published in a prestigious journal.
This is the type of discipline that one day will determine with rigorous logic that
another force must be present in tornadogenesis? First we'll have to teach
meteorologists how to do rigorous logic. Then, if they stop suppressing evidence,
they might realize that their model cannot be improved, and that tornadoes actually
result from a combination of electromagnetic and thermodynamic forces. Then there
will be progress.
And there might be a lot of progress. The following is a list of the
previous sections that described possibilities already queued by the EMHD approach.
A mechanistic model of the evolution of mesocyclones could support
tornado warnings much further in advance (especially for EF2+
tornadoes, which are the most important to predict, and which are
almost always the products of mesocyclonic storms).
Tornado track predictions based on the vertical extent and EM
organization of the storm, combined with the direction of the
upper-level jet stream, might be more accurate than predictions made
by existing methods.
The color of the outside of the cloud could be used (at least by
people there to observe it) as an indirect measure of the degree of
electrification, and thereby, the probability of tornadogenesis.
Currently, assessments of the forces acting on buildings during
tornadoes make unrealistic assumptions about the nature of the flow
fields. Laboratory tests instantiating realistic flow fields could
lead to advances in the way we engineer buildings to withstand the
actual forces.
The structure of the back-sheared anvil, and the density of virga
falling out of it, might be closely tied to tornadogenesis, and
operational emphasis on these factors could lead to more accurate
tornado warnings.
It might be possible to confirm that a tornado has touched down, and
possibly even estimate its force, on the basis of electric currents
in the ground.
A study of non-mesocyclonic vortexes could help isolate the
essential ingredients in tornadoes, leading to a reduction in the
number of unwarned events, and in the number of false alarms.
The next two sections explore a few more possibilities of a more immediate and
practical nature.
77% of all tornado warnings are false alarms, while
27% of all tornadoes occur without warning. And
in none of the cases do we have the ability to predict the strength of the tornado
that might form. Obviously, we're missing something. The rotation of the mesocyclone
is definitely a factor.228,229,230,231 But if it takes a positive
double-layer to turn a normal suction vortex into a bottleneck vortex, and if we're
not even looking at any EM factors in assessing the risk of tornadoes, we will never
have more than loose causal relationships. If we actually start looking at the
active ingredients for tornadogenesis, we could see a major improvement in our
predictive capabilities, and that could save lives.
Measuring electric charges from a distance is not possible, because charged
double-layers build up, and there is no electric field outside of the double-layers.
But moving electric charges generate magnetic fields, and these can be detected from
a distance, because there is nothing to shield them. In fact, the magnetic field
generated by a tornado was measured at 1.5 × 10⁻⁴ gauss from a
distance of 9.6 km away using a
magnetometer.112 There is currently no construct within the
mainstream research community that assigns any significance to these data.
Nevertheless, and with or without a construct that can explain it, if there is a
strong causal relationship between the strength of the magnetic field and the
incidence of tornadogenesis, we should be looking at these data along with the
thermodynamic factors when assessing the tornadic risks.
Figure 162. Data from an array of magnetometers, combined with Doppler radar data, might help pinpoint the location of a tornadic supercell.
And there are two different types of value that might be awaiting us if we pursue
this. First, magnetometers might be able to detect the magnetic field being
generated by the storm, where the stronger the field, the more organized the storm,
and therefore the greater the probability of tornadogenesis. Second, the tornado
itself appears to generate a distinctive field that is greater than the field from
the storm itself. Detecting this field wouldn't help up predict the
tornado, but it would help us confirm that there is, in fact, a tornado on the
ground, and might also help us estimate the strength of the tornado. This sounds
trivial, but it is not. A tornado warning is one thing, but a confirmed report of a
tornado on the ground is something altogether different, and is far more useful
information to people in harm's way. This is especially true if confirmation is not
possible any other way (if the tornado is rain-wrapped, or if it occurs at night).
The typical response to this proposal is that we already have an adequate strategy
for the study of tornadoes, and that there is no need to be looking outside of the
existing framework. Approximately $15 million per year are spent in the U.S. on
tornado research (including the efforts of NWS, a variety of educational
institutions, and some private research facilities funded by NSF). This yields slow
but steady progress in our understanding of tornadic storms. All of this research is
focused on the thermodynamic context in which these storms occur, and on unrealistic
numeric modeling of the dynamics of the storms. And $15 million seems to be about
the right amount of money to spend, considering that tornadoes only kill 89 people
per year.
But all of that is predicated on the assumption that research into the
electromagnetic nature of tornadic storms would be more expensive. Yet this
research might actually be far cheaper. High-precision, highly-directional
magnetometers only cost a couple hundred dollars, and since they are hand-held
units, they could easily be deployed experimentally as well as operationally.
Scientists could use magnetometers to help locate tornadic storms to gather more
data in the field. Considering the cost of field studies, adding a couple of $500
magnetometers to increase the number of successful of intercepts would make a lot of
sense. And fixed installations could be used to help develop more accurate tornado
warnings, along with instrumental confirmation of tornadoes in progress. Every town
big enough to have a fire house and a police station should have a couple of
magnetometers around the outskirts of town, feeding data to a central server that
will issue alerts if critical magnetic field densities are detected.
In the U.S. every year, tornadoes on average destroy $982 million worth of
property,1,2 and kill 89 people.3 This is
not good. And it's just a matter of time before a tornado destroys a major U.S.
city. It would be just too shameful if such a thing was allowed to happen, when it
could have been prevented.
There have been suggestions, and even some funded research, concerning ways of
preventing tornadoes assuming that they are purely thermodynamic. One proposal is to
disrupt the storm using microwave energy beamed down from a satellite.12,13,14,15,16,17 Unfortunately, there is no way to realistically
evaluate the effects of such a strategy, since no realistic thermodynamic model of
supercells exists. (Looking at the effects of an introduced heat source within a
creative mathematics model would be just playing with numbers.) And such a strategy
would be prohibitively expensive to implement just to see how it would work.
The EMHD model suggests that other forces are at work in supercells, and this leads
to the consideration of different strategies for tornado prevention. If a powerful
positive charge in the RFD is one of the essential ingredients in a tornado, and if
that charge could be neutralized, the tornado would dissipate. The mesocyclone would
continue to run at full speed, but the inflow would not get stuck to the ground,
resulting in the release of energy at the ground that is a tornado. And it's at
least theoretically possible that triggering lightning strikes in the RFD would
neutralize enough of the charge to weaken or destroy the tornado.
Several different strategies for triggering lightning have been developed; the
results pictured below are from a rocket with a wire attached to it.232,233 The straight line reveals the location of the triggering wire. The
jagged lines are subsequent strokes of discharge after the triggering wire was
vaporized. Another strategy uses a rocket that leaves a trail of conducting
chemicals in its path.234 Yet another strategy involves using lasers
to heat up the air, which increases its conductivity.235
Figure 165. Lightning rockets, courtesy Chris Kridler.
Figure 166. Possible tornado mitigation strategy.
While it's theoretically possible that this would work, and while it would certainly
be worth testing just for the theoretical significance, it wouldn't seem to
have any practical value. There can be dozens (or even hundreds) of tornadoes in one
day, and having dozens (or hundreds) of teams in the field to deploy lightning
rockets would not be economically feasible. Throw in the fact that tornadoes are
just plain tough to catch, and it's hard to imagine how "tornado fighting" would
ever be cost effective.
But there is a way that tornado fighting could be approached that would be far more
practical. Of the 1,000 tornadoes that occur every year in the U.S., only 10 hit
populated areas, and if we focus on protecting just the populated areas, we have a
much smaller problem to solve. And instead of chasing the unpredictable bastards, we
should just wait for the tornadoes to come to us, and only fight them if they
threaten populated areas. In other words, considering the number of tornadoes that
occur every year, and their unpredictability, and considering the cost of fielding
that many full-time teams to fight them, a "man-on-man defense" is not the way to
go. Rather, "goal tending" would be a more effective use of resources, since we're
only concerned about a very small portion of the field. If every major city had
trained tornado fighters who could respond on short notice to the threat of an
approaching supercell, the chance of successful intercepts goes way up. And instead
of maintaining full-time teams, we should simply call out the tornado fighters when
they are needed.
This is not the way we study tornadoes, because the chance of a tornado coming to us
is so slight. Any given city that is 20 km across, including
suburbs, is going to get hit by some tornado once every 50 years. This is
too infrequent to be useful for research purposes, so we increase our chance of an
intercept by chasing the storms. But if we stop thinking about research, and start
thinking about tornado prevention, the infrequency becomes a practical advantage. It
means that tornado fighters will not have to deploy very often. If a city is to be
hit by some tornado once every 50 years, then once every 15 years, a
supercell that could have spawned a tornado will pass over the city, and
perhaps 10 times a year, a thunderstorm that could have become a supercell
will pass overhead. If 10 times a year tornado fighters go out and fire lightning
rockets into the RFDs, the city will be protected from the threat.
Finding people qualified to fire the rockets will not be hard. Rocketry is a hobby,
and there are thousands of people in the U.S. who have the certification necessary
to fire rockets of this type, just for the fun of it. The National
Association of Rocketry currently has 108 local chapters throughout the
country. So that's 108 cities that have enough rocketry enthusiasts to form a local
club. These people simply need to be trained to intercept thunderstorms. And
certainly anyone who likes firing rockets is going to love firing lightning
rockets. So finding candidates for the couple of days of classroom training, and
a week or so of field training, will not be hard.
So let's see what it would cost to do this.
Table 5. Costs per Deployment
Description
Qty
Price
Amount
rockets (1 primary, 1 secondary, and 1 just to be sure)
3
$700
$2,100
labor (assuming 5 people/team, and 1 hour/deployment)
5
$100
$500
Total
$2,600
Table 6. Costs per City per Year
Description
Qty
Price
Amount
deployments (rockets + labor, from the table above)
10
$2,600
$26,000
training (assuming 2 new people per year on the team)
2
$12,000
$24,000
Grand Total
$50,000
At $50,000 per year, the 50-year cost comes out to $2.5 million. Since the 50-year
event typically costs at least $10 million, that's a 4-to-1 return on investment, or
an average yearly net savings of $150,000 per city. And that is practical.
And in addition to saving money, we'd also be saving lives.
Since the aspect of the storm that needs to be attacked is the RFD, and which can be
approached from the NW without having to get inside it, the tornado fighters would
not have to get in harm's way to deploy the rockets. The major safety concern would
be the risk to aviation in the vicinity.
For research purposes, we can go out in the middle of nowhere, and test the
technique on tornado-warned, actively tornadic supercell thunderstorms. We can rest
assured that there are no airplanes in these clouds, since no airplane can
survive the hostile conditions within such storms (50 m/s downdrafts, grapefruit-sized hail, etc.).
But the practical application of this technology would be a different scenario. To
protect a city from a tornado, the tornado fighters would obviously be much closer
to a city. This means that they would be close to a major airport. Additionally,
they wouldn't always be firing into actively tornadic supercells. If they deploy 10
times a year, and if a supercell only passes overhead once every 15 years, then
149⁄150 of the deployments will be into normal cumulonimbus
clouds. And there very definitely could be airplanes within these clouds.
Therefore, if tornado prevention is to become a practical reality, air traffic
controllers will have a significant role to play. Once a meteorologist identifies a
threatening thunderstorm, and calls out the tornado fighters, the local air traffic
controllers will have less than 10 minutes to clear the thunderstorm of airplanes,
or to call off the tornado fighters if they cannot.
It will be easy to get the buy-in of the Federal Aviation Administration (FAA),
since a tornado hitting a major airport is FAA's worst nightmare. Planes fly nicely
in the high wind speeds of a tornadic storm, but without the expertise of a pilot,
they land poorly. So FAA should be as interested as anybody in seeing this
initiative succeed.
Figure 167. Tornado near Stapleton International Airport, Denver, CO, 1988-06-15, credit Richard Filhart, courtesy NCAR.
Figure 168. Planes that have landed poorly after flying in a tornado, courtesy Tinker AFB History Office.
And certainly, asking air traffic controllers about the location of planes in the
vicinity of an airport will not exactly be an unusual question. It's just that they
have never been asked this specific question before. Being able to answer
this question with absolute certainty might take new hardware, and/or new software,
and/or a new protocol. FAA will have to estimate the cost of its part of this
initiative, and that will then be added into the cost-benefit analysis.
This has been, and will continue to be, a massively speculative work. The key data
to make or break the central tenets have not been collected, because the hypothesis
that suggests their significance has not existed until now. Regardless, the
situation dictates that anyone proceeding into this territory must leave terra
firma behind. Nevertheless, it was demonstrated that the EMHD model is
physically possible, and that nothing in a 200 page description of
well-known, distinctive characteristics within the problem domain fell outside of
its scope. In these respects, this construct is clearly superior to existing models.
It remains to be seen whether future research will fill in the blanks, or begin to
reveal discrepancies. But since the existing frameworks have already hit their
limits well short of completion, the EMHD model represents our best opportunity for
progress.
Normally, a well-researched work begins with a review of the previous works. But the
present work is by no means a simple extension of what has gone before, and as such,
it would have been confusing to introduce this research in that format. So the
relevant aspects of existing theories were mentioned in each section, while none of
them were discussed head-on. It is nevertheless appropriate to at least mention the
central contentions of several of the better-known theories, and to cite the reasons
for not simply extending those works. (This section will be expanded in the future,
as time permits.)
Bernard Vonnegut et al. — Joule Heating
This was the first modern electromagnetic theory of tornadoes, and it was based
largely on the extremely robust EM properties of the Blackwell/Udall tornado on May
25, 1955. Specifically, there were reports of sustained arc discharges at the
tornado/mesocyclone interface. It was hypothesized that this lightning was creating
enough heat to put the storm into overdrive.105,106,107,108,109,110
This theory was discussed in the section entitled "Electric Tornadoes?" and elsewhere.
Rathbun, E. R. — Positive Ions
This theory asserts that a brush stroke of lightning discharge will ionize the air,
and the positive ions near the ground will then be attracted to the negative charges
inside the cloud.121 As the positive ions move toward the cloud,
they will begin to rotate due to the Earth's magnetic field.
This ignores the fact that proton-neutron pairs are 4,000 times heavier than
electrons. Hence positive ions do not move appreciably in any ionized channel
— it is the electrons that do the moving. This leaves Rathbun without a way of
explaining the movement of the air, since the movement of electrons does not
accelerate the air through which it passes.
As concerns the initiation of rotation due to an ExB force from electric charges
moving in the presence of the Earth's magnetic field, see the comments on the
work of Dehel et. al. (below).
Silberg, P. — Ring Current
Also based on the Blackwell/Udall tornado, Silberg proposed that a "ring current"
existed at the tornado/mesocyclone interface, which generates RF energy capable of
heating the air, resulting in a tornado.122
Thompson and Thompson define the ring current or ring discharge as an electrodeless
electrical discharge where the electrical field within the gas forms closed curves.
They describe laboratory experiments in which the required electrical field is
produced by induction with the aid of an enclosing solenoid through which a
time-varying current is passed similar to a solenoid used for induction
heating.236
Silberg calculated that a current density in a sustained ring discharge
equal to the current density in an instantaneous lightning strike could
project enough heat onto the ground to produce a tornado. Yet an electromotive force
up to the task was not identified. Furthermore, the evidence of elevated
temperatures on the ground is extremely sparse.
More problematic is the supposition that a ring current (or any other heat source)
could create a tornadic flow field. To get the lowest pressure and fastest winds at
the ground level, the majority of the energy conversion has to occur at the ground
level — and it has to be absent elsewhere.
Berson, F. A., and Power, H.
This theory states that moving electric charges become tornadic because of the
influence of the Earth's magnetic field.114
See the comments on the work of Dehel et. al. (below).
Evgeny Krasilnikov
Comments on this theory are still in preparation.22,124
Edward Lewis — Ball Lightning and Related Plasmoidal Effects
This theory essentially threw tornadoes into a vat of poorly understood phenomena
that can all be summarized as inexplicable manifestations of
electromagnetism.164 Lewis never demonstrated the principles
responsible for ball lightning, and his work within this field of focus merely
identified many strange things which might all be attributed to the same underlying
cause — whatever that might be. Hence the work was not specific enough to
support specific criticisms.
Wallace Luchuk — JxB Force
This theory suggests that the energy of the tornado comes from the interaction of a
storm generated toroidal electric current field with the Earth's magnetic field (a
JxB force). The intensification of the tornado when touching down is explained by
the stimulating effect of the Earth's conductivity.97
While this is one of the few works that directly addresses the root issues in
tornado theory, and seeks to describe forces in a fully mechanistic way, it leaves
way too much on the table. The only part of the tornado that is treated is the
surface/tornado interface, and the only aspect of this that is discussed is the
rotation. There is no mention of the source of the low pressure or of the electric
field that are cited as the driving forces in the phenomenon. Most importantly, no
mechanism is provided for constraining the electric current to the narrow base of
the tornado.
As concerns that actual strength of the ExB force, see the comments on the work of
Dehel et. al. (below).
Hiroshi Kikuchi — Magnetic Reconnection
Kikuchi explores possibilities associated with magnetic reconnection of moving
electric charges.125
While moving electric charges, in supercells and more dramatically in tornadoes,
definitely generate magnetic fields, we should expect the magnetic force to be near
infinitesimal compared to the electric force at non-relativistic speeds. The
electric force was shown to be just barely within range to modulate the behaviors of
the storm. This puts the magnetic force way, way out of range.
Peter Thomson — Charged Sheath Vortex
This theory maintains that charges in motion inside the mesocyclone develop magnetic
fields that resolve into a unified structure, and that once established, this
structure forces new air to enter from the bottom only, and to contribute to the
structure as it spirals into the vortex.126
Aside from the fact that the magnetic fields are too weak to influence thermal
fluxes, this theory doesn't account for the concentration of energy at the base of a
tornado. When encountering friction at the surface, the air speed will be reduced.
This will reduce the magnetic field density, and the vortex will fall apart at the
surface.
Mikhail Scherbin — Angular Momentum of Lightning
This theory states that lightning strikes will generate angular rotation in the
surrounding air, due to the magnetic fields that they generate, and that this
angular momentum builds up from successive lightning strikes, resulting in rotation
in the air being drawn into a mesocyclone.127 This rotation then
matures into a tornado (somehow).
Even if extremely small-scale rotation could result in large-scale angular
momentum, this ignores the fact that the charge flow in a lightning strike involves
many reversals of direction, where the magnetic fields reverse as well. A net
angular momentum left in the air is not likely.
Tom Dehel et al. — Lorentz Force Acceleration
This work is similar to the present work in some respects, but fundamentally
different in others.128 It asserts that:
The air being drawn into a tornado is electrically charged. The sign of the
charge is not identified. The source of the electric charge is triboelectric
charging by collisions of particles within the flow of air. Another source
of charged particles is the natural ionization of atmospheric molecules such
as oxygen. Additional ions are also created through the action of strong
atmospheric electric fields.
An estimate of 2.14 × 10¹⁴ charged
particles/m3 is given. The charge per particle is estimated at
3.2 × 10⁻¹⁷ C. This means a space charge of 6.8 × 10⁻³ C/m3 in the tornadic inflow. At an estimated
20 kV/m of electric field between the ground and the cloud, this yields 136
N/m3 of upward force on the air, while the force of gravity is
only 6.75 N/m3. Hence the electric force pulling the air up is 20
times stronger than the gravitational force pulling it down. Therefore, the
"updraft" is considered to be (at least partially) a product of the electric
force.
The rotation of the tornado is considered to be a product of the Lorentz
force, where the air is deflected into a spiraling inflow pattern because it
is a moving electric charge within the magnetic field of the Earth.
Critics have argued that:
The estimate for the number of charged particles, and for the amount of
charge in them, is high.
The estimate for the strength of the electric field present under a
supercell (20 kV/m) is also high. (Actual readings are more like 5 kV/m.)
Even if the actual number of particles involved is 2.14 × 10¹⁴, that's small in comparison to the total number of molecules in a
cubic meter of air (roughly 1 × 10²³). If the electric
force is only operating on one billionth of the molecules, the motion of
such particles will not create a noticeable effect on the surrounding air.
Hence the contention that the updraft is a manifestation of the electric
force is indefensible, no matter how strong the electric field. The
contention that the inflow is deflected into a spiral by the Lorentz force
is indefensible for the same reason. (The charged particles will be
deflected, but this will have little effect on the surrounding air.)
Even with the over-estimated forces, the Lorentz force contribution was
shown to be barely sufficient to keep the vortex rotating above the surface,
and is not even capable of "spinning up" the vortex. And this is only
considering the friction in the air above the surface. The friction
at the surface is at least 1,000 times greater than all of the
friction encountered in the remainder of the distance between the ground and
the cloud. So forces powerful enough to rotate air at the surface
are never considered, leaving tornadoes unexplained.
No explanation is given for tornadoes that rotate anticyclonically.
Most tornadoes in the Northern Hemisphere rotate CCW, and
most in the Southern rotate CW. So the prevailing direction is
"cyclonic." Since the direction of the Earth's magnetic field is opposite
across the hemispheres, the Lorentz force will act in the opposite
direction, and the proposal works (theoretically) for most
tornadoes, but leaves the exceptions on the table. It's obvious that if we
simply reverse the polarity of the charges, the Lorentz force will act in
the opposite direction. But positive and negative charges play very
different roles in a thunderstorm, and we can't just switch the poles and
expect the storm to behave in the same way. In fact, ambiguity of polarity
has never been observed, in CCW or CW storms, in the Northern or in the
Southern hemispheres. This suggests that at most, the Lorentz force might
contribute to cyclonic tornadoes, and detract from anticyclonic ones, but is
not a significant factor in either.
The present work responds to Dehel et al., and their critics, in saying that the
tornadic inflow is definitely charged, but the important thing is not its
electrostatic attraction to the cloud, but rather, to the ground because of an
induced charge in the surface of the Earth. And while Dehel et al. are thinking in
terms of charged water molecules, because these are "typically" the charge carriers
in a thunderstorm, the present work assumes that the positive charges are being
manufactured at the top of the cloud, and that on the way down to the ground, there
is time for the charges to become distributed throughout the oxygen and nitrogen
molecules, meaning far more body force. Dehel et al. need to look for
particles of a particular size in order to get the gyroradii that they want, but the
present work does not have the same motive, and there are a number of lines of
evidence in support of the contention that the nitrogen and oxygen molecules are
getting ionized.
Hiroshi Kikuchi — Electric Helicity
This work observes that helicity can be generated by an electric quadrupole operating
above the breakdown voltage of the air.237,238 In Figure 169, note the blue halos around the two upper branches of this
discharge.
Figure 169. Helicity surrounding arc discharges in an electric quardrupole, courtesy Hiroshi Kikuchi.
This is not relevant to the study of tornadoes, as the helicity is a product of the
Lorentz force, but requires the relativistic speeds in an arc discharge to develop
sufficient magnetic fields to accomplish such acceleration. In a tornado, there is
no sustained arc discharge, and the magnetic fields are far too weak, as established
by Dehel et al.
Forest Patton et al. — Descending Mesocyclones
This theory states that a downdraft going through a bi-level charge structure in the
middle of the cloud can create a downward-pointing cone, where the inner wall of the
cone is negatively charged, and the outer wall is
positively charged.130 Then a combination of latent heat release,
centrifugal force, and electric force will pull the cone into a rapidly-rotating
funnel cloud, that could descend to the ground and become a tornado.
Patton et al. do not seem to realize that some of the givens are mutually exclusive.
They discuss rotating charges with centrifugal forces, and then they inject a
downdraft into the mix, to create a cone. Then, as cold air in the downdraft meets
warm air in the updraft, precipitation is generated, which is centrifuged out of the
cone, pulling in more cold air from above, and warm air from below. But how were
these charges rotating in the first place, and what keeps them rotating, such that
the centrifugal force will perform as expected? In order for this theory to be
credible, the force necessary to create and maintain the rotation has to be
identified.
Richard Heene et al. — Magnetic Acceleration
This theory maintains that the rotation of charged particles around the updraft
within the mesocyclone generates a magnetic field along the axis of the mesocyclone,
and that below the cloud, this magnetic field projects down to the Earth, where it
can accelerate magnetically-responsive particles at the surface toward the cloud.
The acceleration of charged particles then accelerates the air, and this causes the
low pressure within the tornado.239
It is certainly true that rotating electric charges will generate a magnetic field.
(See Figure 170.) But it is naive to think that this will cause
the robust updraft inside a tornado. Outside of the mesocyclone, the magnetic lines
of force will splay, and the field density will diminish rapidly. At the surface,
magnetic fields of roughly .2 gauss have been measured, which is surprisingly high,
but is still low in comparison to the Earth's magnetic field, which is roughly .5
gauss. If a field density of .2 gauss could accelerate particles, why would there be
any particles left at the surface, after the Earth's magnetic field had its wily way
with them before the storm arrived? Furthermore, iron is the only element that is
likely to be present and that is highly responsive to the magnetic force. But
tornadoes are possible even where there is little to no iron present (such as in
vortexes over the ocean). Above the surface, where the field will be stronger, there
is only air. Nitrogen and oxygen are not responsive to magnetism. Water molecules
are present, and these are diamagnetic, which means that in the presence of a
magnetic field, the molecules become polarized and then can be accelerated
by the field. But the effect is extremely weak, and it would take roughly 100,000
gauss to overcome gravity.240
Figure 170. Magnetic lines of force generated by rotating electric charges. Electrodynamics applet by Paul Falstad.
Electric Universe — Ionosphere-Surface Current
This theory states that the Earth is negatively charged, and that the atmosphere is
a leaky capacitor, where there is a fair-weather current all of the time flowing
from the Earth toward outer space, but that unique conditions can reduce the
resistance within this capacitor, resulting in an enhanced
current.241,242 One such condition would be the reduced pressure
within a mesocyclone, which would increase the conductivity of the column of air
from 1 km to over 12 km above the
surface. This is only a fraction of the distance to the ionosphere, but it traverses
the densest part of the atmosphere, and this is the source of
2⁄3 of the resistance between the surface and the ionosphere.
Hence the mesocyclone could be opening up a conduit through which a current could
flow.
The problem with this theory is that is does not explain vortexes that descend from
non-mesocyclonic thunderstorms. It also does not take into account the fact that the
global current is extremely weak. The "fair weather field" is something like
.1 kV/m, which is vanishingly small compared to the fields in
a thunderstorm. So it is far more likely that storm-generated fields are the only
forces that could possibly be influential. It also labors under the same criticisms
directed at the joule heating theory — the airflows in a discharge vortex are
fundamentally different from those in a tornadic vortex.
This work suggests that similarities between formulas in thermodynamics and
electromagnetism offer opportunities to merge the two disciplines on the basis of
the similarities.244
For a clearer idea of what they're talking about, you'll have to read the paper. But
just to give a (bad) example, let's consider merging the Coriolis Effect with the
Lorentz force. Air approaching a tropical cyclone appears to be deflected to the
right in the Northern Hemisphere because of the rotation of the Earth. If the air is
charged, it will also be deflected, because it is generating a magnetic field, and
in the presence of the Earth's magnetic field, there will be a ExB drift. Therefore,
we can merge the two principles, and know more about both the Coriolis Effect
and the Lorentz force because we picked up a few terms from both sets of
equations. Now we can expect all cyclonic motion to be exhibiting electrodynamic
effects, since we know by the Coriolis-Lorentz equations that these are coupled
forces.
Figure 171. Analogies between hydrodynamics and electromagnetism, courtesy Büker and Tripoli.
Such reasoning is fatally flawed, and is a gross misinterpretation of the nature of
EMHD on the part of the authors. Formulas in different disciplines might be the
same, but unless they are the same for the same reasons, terms from one discipline
cannot be substituted directly into formulas from the other.
Ironically, these authors would probably agree with the hypothesis presented in this
paper, since the toroidal form is important in both fluid dynamics and in
electromagnetism, and such proves that the formulas can be merged. But the present
work would reject their approval. The central hypothesis is that because of
the coincident forms, there is a positive feedback loop, and this is responsible for
the emergence of a new property set. Toroidal flows don't know to be toroidal so
physicists can re-use EM equations on them, and seeing superficial similarities in
formulas does not deepen our appreciation of the underlying physics. It merely opens
the door to category errors.
Anonymous — Cymatics
This theory states that tornadoes are caused (at least in part) by self-organizing
sound waves. (See this for an example of the complex patterns
that can appear in resonating fluids, or gases with particulate matter in them.)
This is a "anything's possible" theory that needs to be developed into a "this is
possible" theory before it can be evaluated.
It should be noted that research has shown a clear relationship between the
frequency of sound waves generated by a tornado and the size of the
tornado.245 The researchers went so far as to say that very low
frequency sound waves might be useful in tornado detection from a great distance.
But whether these sound waves are artifacts or reentrant factors in their own right
remains to be demonstrated.
Anonymous — Sun Spots
This theory hasn't been traced back to a specific source yet, but the idea is that
tornadoes are most likely when Sun spot activity is the greatest.246
Interestingly, there does seem to be an inverse relationship between sunspots and
tornado fatalities. Notice that in Figure 172, for the last 10
cycles, in each sunspot minimum there was only one peak in the fatality smoothed
curve.
Figure 172. Tornado fatalities compared to sunspot cycles.
The nature of the relationship is unclear, but it's interesting to note that recent
research at CERN on the CLOUD project has identified a correlation between sunspots
and the strength of the Earth's geomagnetic fields (as the particles from CMEs
augment the Earth's field), and a weaker field allows more cosmic rays to penetrate
the atmosphere. These have been shown to increase the condensation of water vapor.
Hence fewer CMEs result in more clouds. The extrapolation of this reasoning would be
to the possibility that more clouds mean more storms.
Miscellaneous Probabilistic Theories
There are a wide variety of theories positing the existence of causal relationships
between tornadogenesis and external factors.
Tornadoes are most likely above oil fields, since the oil has a net
charge.247
Tornadoes are most likely above magma chambers, where magma flows are
generating electric currents and magnetic fields.248
Tornadoes are most likely when gravity waves are passing through the
air.249,250,251
Extreme weather in general is more likely when various alignments of the Sun
and the planets are present.252
Tornadoes follow rivers, roads, railroad tracks, etc. (This has never been
quantified.)
Tornadoes are most likely to start and stop at the transitions between
positive and negative anomalies in the Earth's magnetic field. (The Earth's
magnetic field is approximately 0.5 gauss, with local fluctuations of +/-
0.004 gauss, due to the magnetic properties of the crust. Click
here to see a 7.18 MB image comparing tornado tracks
with magnetic anomalies. The tornado track and magnetic anomaly data are not
perfectly indexed — the projections and central meridians are slightly
different. A better image will be posted when it becomes available.)
Attempts to quantify the correlation are in progress.
None of these theories have demonstrated how the forces in question could explain
the wide variety of distinctive properties of supercells and tornadoes.
Conclusion
There is no shortage of epiphanies within the solution domain, but the epiphanies do
not pass the quickest of sanity checks. What is needed is a thoroughly considered
theory that covers the length and breadth of the problem domain with plausible
physics. Such has been, and will continue to be, the objective of the present
work.
There are a wide variety of approaches to further developing these ideas. Which
approach would return the most benefit for the least cost is still under
consideration.
Computer Simulation
Generally the first place to start is to attempt a computer
simulation of the proposed forces. While a pure physics simulation
of the proposed EMHD interactions in such a complex system would be
far too processor-intensive, a cheaper alternative would be to
estimate the forces and to instantiate the effects in an algorithmic
modulation of a thermodynamic simulation. Heuristics could be used
to fine-tune the artificial forces until an exact solution is
achieved. Then the model could be queried for specific values to
compare against existing field data. If the model can achieve exact
solutions faster, and if the model is applicable to a wider variety
of storms with less fine-tuning, it would be more useful than
existing modeling strategies.
This would still take a supercomputer, and supercomputer time takes
money. Unfortunately, that kind of money isn't available for this
kind of research, so this strategy will have to wait for later.
Laboratory Demonstration
One of the central contentions concerning tornadoes is that the
inflowing air is positively charged, and that such inflow tends to
hug the surface because of an induced electrostatic potential
between it and the Earth. Then, it is released from that bond by an
electric current through the low-pressure channel at the centerline.
A simple laboratory apparatus could demonstrate this phenomenon, and
the properties of the vortex so created could be compared to the
properties of tornadic vortexes.
One of the central tenets of the EMHD model is that the
tornadic inflow is positively charged, and that the charge
increases with proximity to the ground, as well as with
proximity to the center of the inflow channel. Confirming
this would take a space charge study.
It would be much easier to do such a study on waterspouts.
Off the Florida Keys, waterspouts are quite
prevalent, so the chance of a successful intercept
during peak season (i.e., late summer) is high.
Since waterspouts are consistently weak (≤ EF1),
the risk of injury during an intercept is low.
Waterspouts typically move slowly and predictably,
so they are easier and safer to intercept.
High-speed motorboats attempting intercepts can
legally travel faster than cars on land.
Motorboats are not limited to roads. Traveling "as
the crow flies" is faster, and opportunities won't
be missed because there wasn't a passable road to
the intercept point.
Motorboats are far more maneuverable than cars, at
low and at high speeds.
The color of the water provides visible evidence of
the near-surface flow field, providing information
that would otherwise take a large array of
anemometers.
Waterspouts don't have saltating and/or creeping
particulate matter in the inflow channels that could
perturb electric field and space charge studies.
Magnetometer Studies
The magnetic fields, of supercells and of the tornadoes
themselves, should be studied.
Triggered Lightning Studies
The most incontrovertible test would be to see if lightning
rockets could be used to downgrade or eliminate the tornado.
If the central contention is that electromagnetism is an
integral part of the structure of a supercell, then why
don't we just try taking electromagnetism out of the
equation and see what happens?
In addition to being the best test of the theory, it will
also be a test of the practical application.
In order to conduct these tests, a
certificate of authorization must be
obtained from FAA. Unfortunately, one of FAA's requirements
is that the research be publicly funded, and of course,
there is no funding for this paradigm. So this will have to
wait for the project to pick up more momentum from the other
strategies listed above.
While the present proposal seems simple enough, it took a lot of work to extract
that simplicity from a far larger body of literature. Yet the amount of work that
remains to be done is staggering. The specificity and accuracy of the theory needs
to be increased, and the theoretical implications of such increases need to be fully
considered. If the theory persists, laboratory and field studies need to be
conducted to further challenge it. Insofar as there is no funding for this line of
reasoning, the work can only be done by volunteers. People with skills in fluid
dynamics, thermodynamics, meteorology, electrostatics, electrodynamics, geophysics,
plasma physics, computer programming, and radar can all add value to this project.
Anyone wishing to contribute will share in the credit, and should e-mail the author
to coordinate efforts.
Volunteers can also help advance this initiative simply by writing to their elected
representatives, and urging them to fund research such as this. U.S. citizens can
also write to the members of the relevant Senate Subcommittee.
(When writing to congresspersons, do not bother to be verbose, as the letter is only
going to be read by a congressional aide. Simply state the issue and which side of
it you're on. This will get the letter into one stack or another. The representative
will then be informed of the number of letters in each stack.)
The author cannot help but acknowledge the tireless efforts of the late Dr. Bernard
Vonnegut, who almost single-handedly carried the EM torch for 40 years, regardless
of the unanimous opinion of the meteorological community that he was wrong. Early in
this paper, it was useful to distinguish the present work from Vonnegut's, as
typically, anytime EM theories of tornadoes are presented, meteorologists simply
practice their Vonnegut-bashing technique, and never bother to listen to what's
actually being said. So it served the purposes of this initiative to say that this
is definitely not the same as the previous generation's theory. But of the
key evidence cited in this paper, more of it came from Vonnegut than from any other
source. Had he not documented the distinctive EM properties of the tornadic storms
in Toledo, OH, 1965-04-11, and in Huntsville, AL, 1974-04-03, and had he not
investigated the EMHD properties of discharge vortexes, it would have been
impossible to get all of the evidence sorted out into the present
framework. So the present work's first and greatest debt is owed to this paradigm's
earliest and staunchest supporter — thanks Dr. Vonnegut.
Figure 173. Bernard Vonnegut Jr., 1914~1997
The second debt is to Wallace Luchuk, who by his work in the late 1990s, and in
numerous correspondences, taught the author to analyze tornadoes in fully
mechanistic terms. Luchuk was also the first to clearly state that the primary
energy conversion in a tornado is at the ground, which is central to the present
work. We came to disagree on the solution, but with the correct approach and a
well-defined problem, the rest is easy, and Luchuk gets the credit for paving the
way for the present work.
Thanks to Kevin Linzey for listening patiently to many early versions of this
theory, and for his clear-headed, objective analysis of each contention.
Thanks to Alexandra Duffy for editorial review of this paper.
Thanks to Kevin Johnston, Michael Gmirkin, Ernest Richars, Thomas Beck, Ronald Townsend,
Carl Johnson, Roger Chandler, Jr., Tim Erney, Michael Harrington, Kiyoung Kim, Paul Olsen,
Ron Graves, Vladislav Stanev, Hubert DeVries, and Roger Johnson for their many criticisms
and suggestions.
9. OFCM/SDR, 2007:
Multifunction Phased Array Radar (MPAR) Symposium Summary Report.
Office of the Federal Coordinator for Meteorological Services and Supporting Research (OFCM), and the U.S. Office of Science and Technology Policy, Committee on Environment and Natural Resources, Subcommittee on Disaster Reduction
12. Krasilnikov, E. Y., 1994:
Solar power station: Energy source for suppression of destructive tropical cyclonic hurricanes.
45th International Astronautical Congress, Jerusalem, Israel, Oct. 9-14
13. Krasilnikov, E. Y., and Smakhtin, A. P., 1995:
Microwave power from space for suppression of destructive tropical hurricanes.
46th International Astronautical Congress, Oslo, Norway, Oct. 2-6
14. Eastlund, B. J., 1998:
Systems considerations of "Weather modification experiments using high power electromagnetic radiation".
Workshop on Space Exploration and Resources Exploitation, Explospace, European Space Agency
15. Eastlund, B. J., 1999:
Mesocyclone Diagnostic Requirements for the Thunderstorm Solar Power Satellite Concept.
Proceedings of The Second Conference on the Applications of Remote Sensing and GIS for Disaster Management
21. MacGorman, D. R., and Rust, W. D., 1998:
The Electrical Nature of Storms.
Oxford University Press, pgs. 52, 57, 73, 106, 110, 118, 164, 192 in 422.
32. Church, C. R., and Barnhart, B. J., 1979:
A review of electrical phenomena associated with tornadoes.
11th Conference on Severe Local Storms, American Meteorological Society, 342-377.
87. Gallagher, F. W., Beasley, W. H., and Bohren, C. F., 1996:
Green Thunderstorms Observed.
Bulletin of the American Meteorological Society, 77: 2889-2897.
109. Sozou, C., 1984:
Electrical Discharges and Intense Vortices.
Proceedings of the Royal Society of London, Series A, Mathematical and Physical Sciences, 392(1803): 415-426.
142. Rasmussen, E. N., Peterson, R. E., Minor, J. E., and Campbell, B. D., 1982:
Evolutionary characteristics and photogrammetric determination of windspeeds within the Tulia outbreak tornadoes 28 May 1980.
12th Conference on Severe Local Storms, American Meteorological Society, 301-304.
143. Jensen, B., Marshall, T. P., Mabey, M. A., and Rasmussen, E. N., 1983:
Storm scale structure of the Pampa storm.
13th Conference on Severe Local Storms, American Meteorological Society, 85-88.
184. Schmidlin, T. W., Hammer, B. O., King, P. S., and Miller, L. S., 2003:
Wind speeds required to upset vehicles.
Symposium on the F-Scale and Severe-Weather Damage Assessment, American Meteorological Society
198. Kennedy, R. E., and Fredrich, E. R., 1989:
Tornado warning system.
freepatentsonline.com, 4812825.
199. Jones, H. L., 1955:
Research on Tornado Identification.
3rd Quarter Progress Report, Contract No. DA 36-039 SC 64436, Stillwater, Okla. A. and M. College, 8-35.
214. Schultz, D. M., Kanak, K. M., Straka, J. M., Trapp, R. J., Gordon, B. A., Zrnić, D. S., Bryan, G. H., Durant, A. J., Garrett, T. J., Klein, P. M., and Lilly, D. K., 2006:
The Mysteries of Mammatus Clouds: Observations and Formation Mechanisms.
Journal of the Atmospheric Sciences, 63, 2409-2435.
218. Renno, N. O., Abreu, V. J., Koch, J., Smith, P. H., Hartogensis, O. K., De Bruin, H. A. R., Burose, D., Delory, G. T., Farrell, W. M., Watts, C. J., Garatuza, J., Parker, M., and Carswell, A., 2004:
MATADOR 2002: A pilot field experiment on convective plumes and dust devils.
Journal of Geophysical Research, 109, E07001.
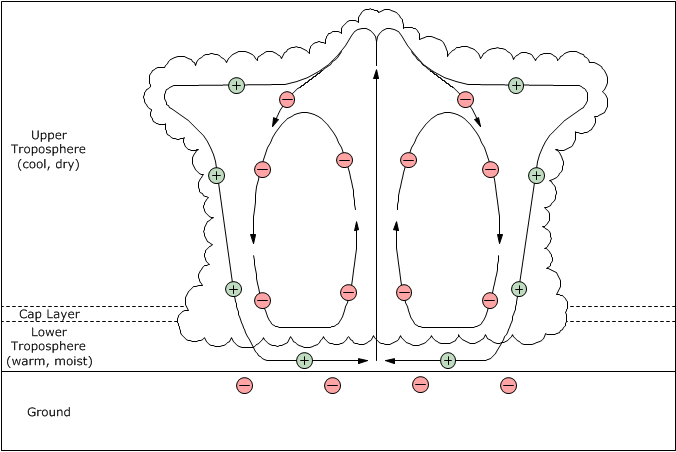
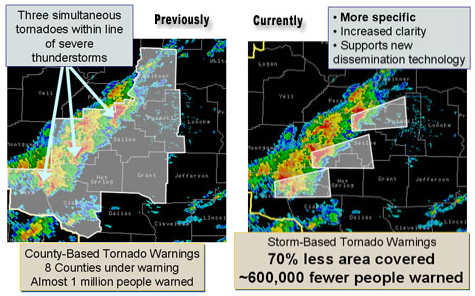
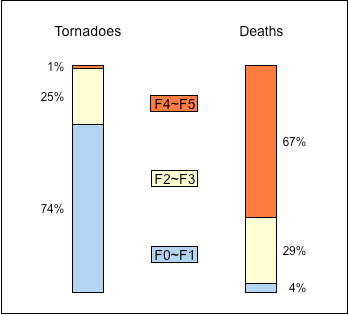
.jpg)
.jpg)
.jpg)
.jpg)
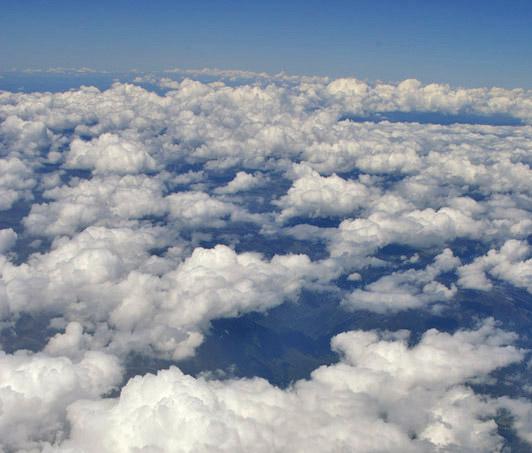
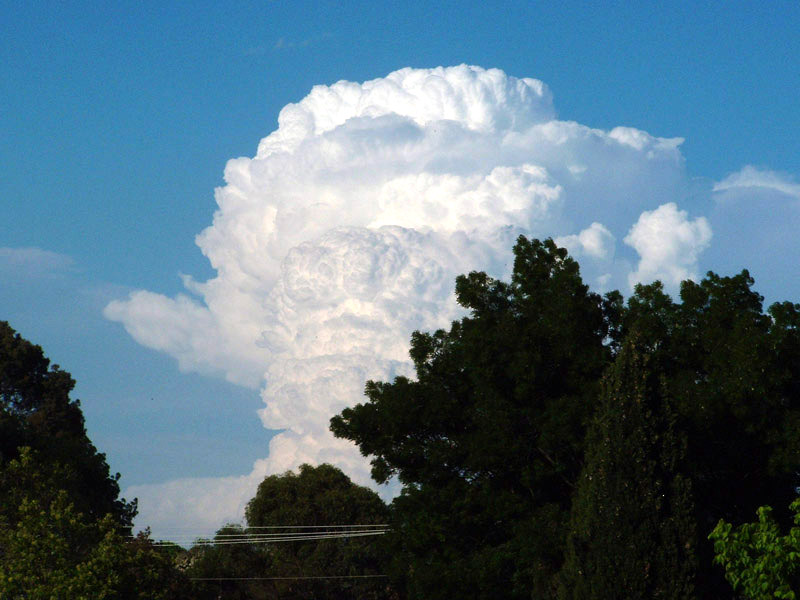
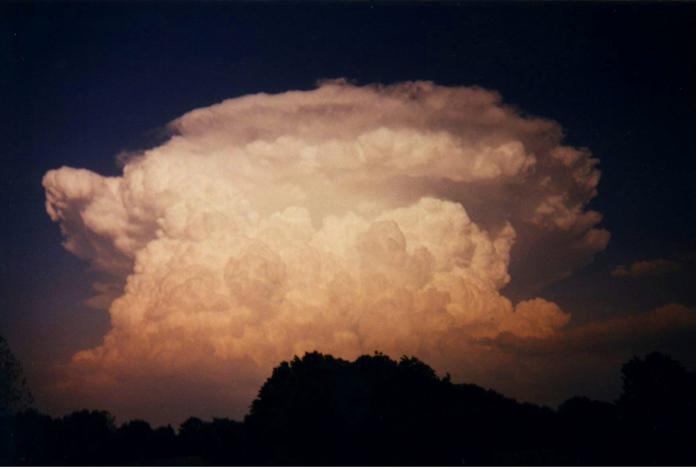
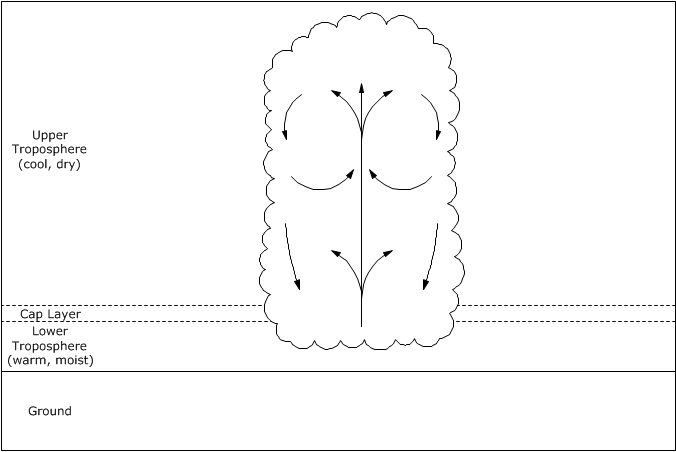
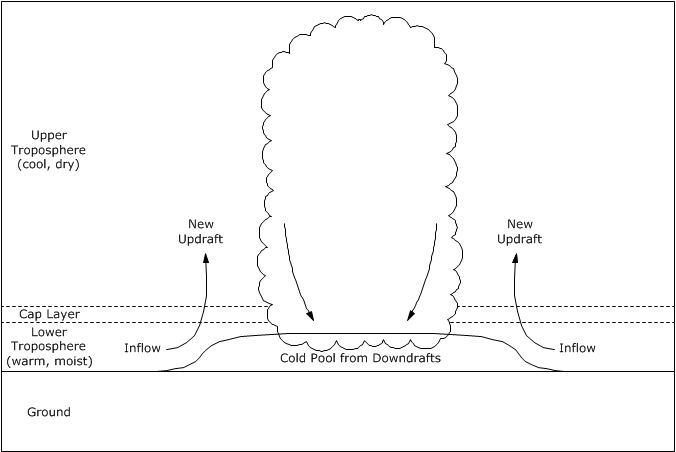
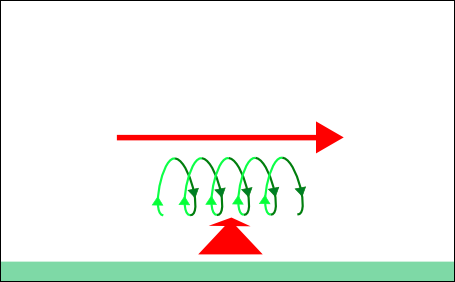
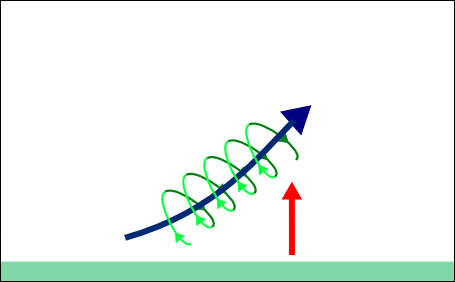
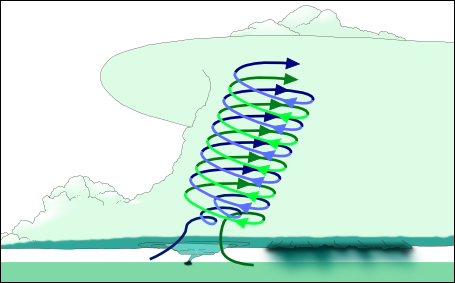
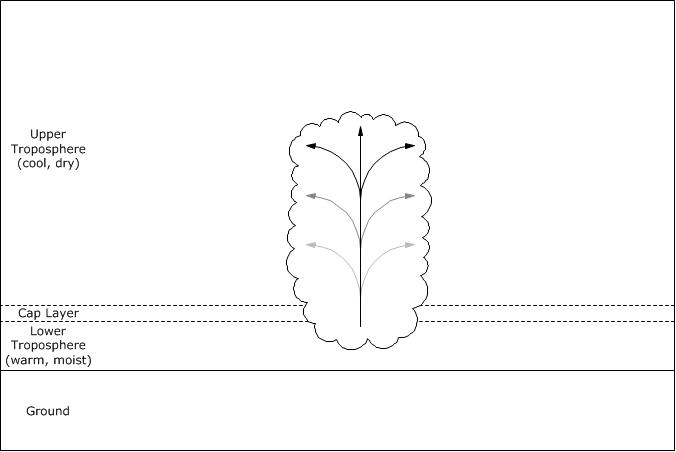
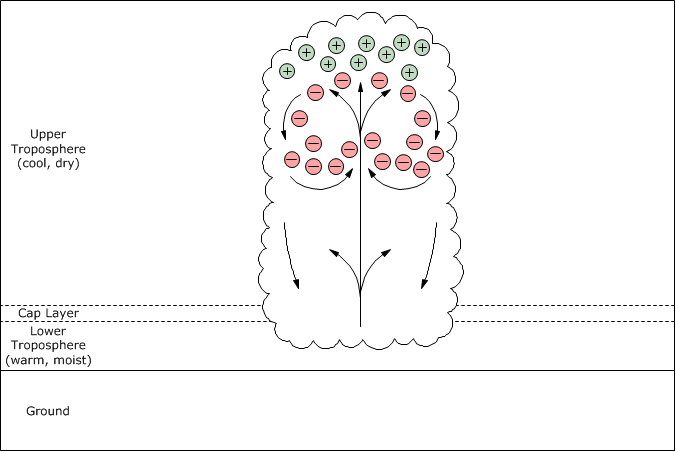
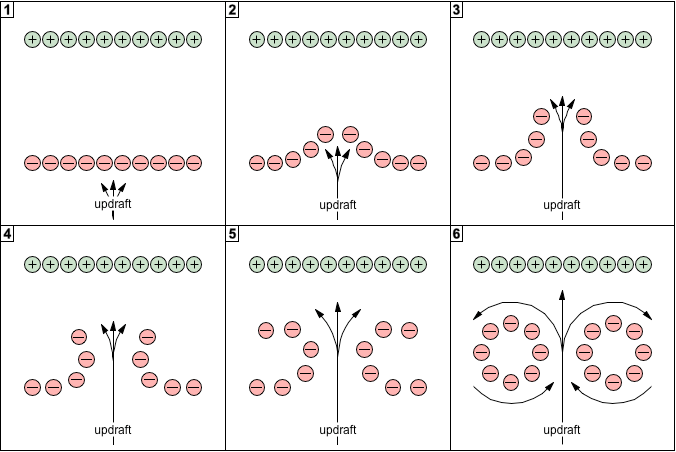
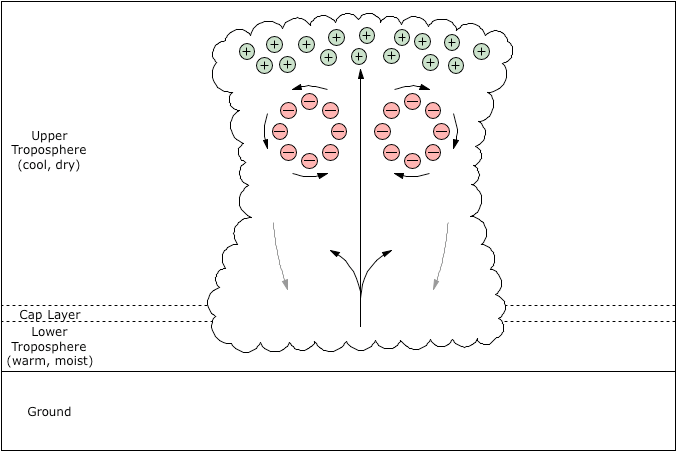
.png)
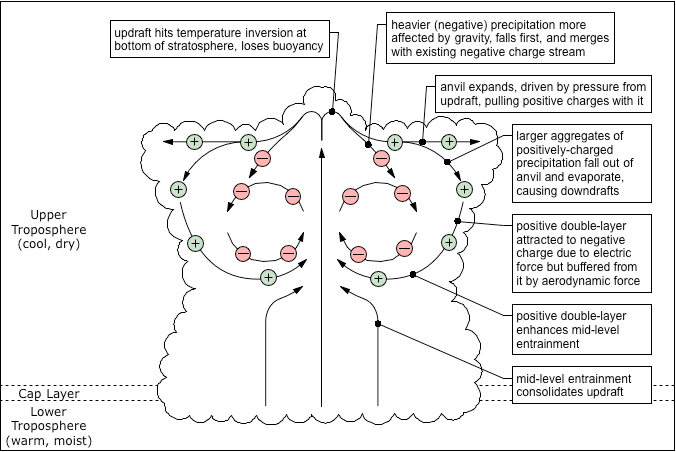
.jpg)
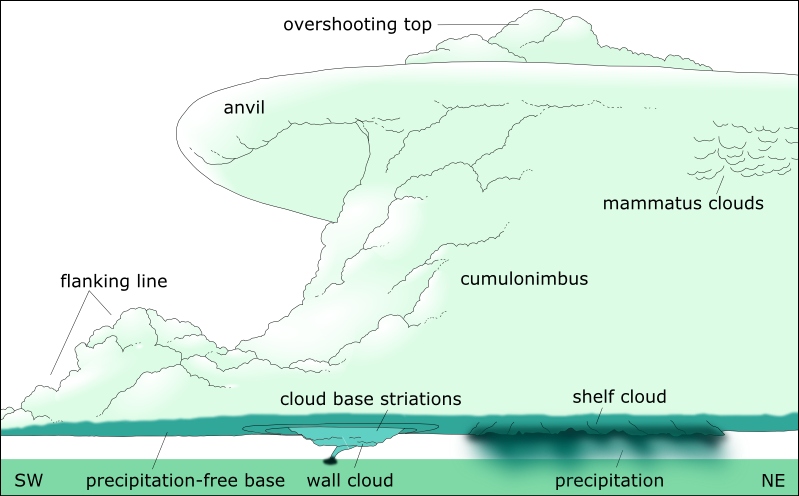
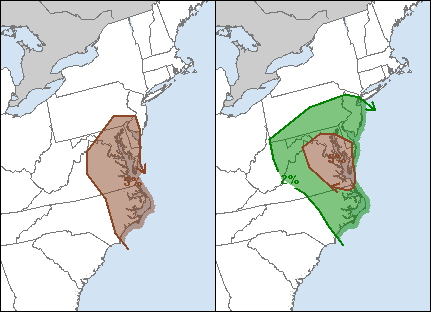

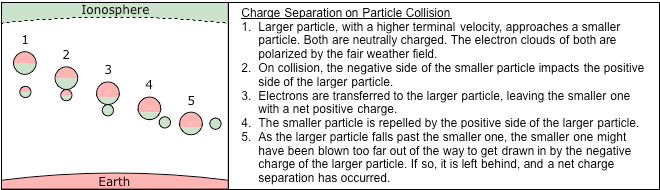
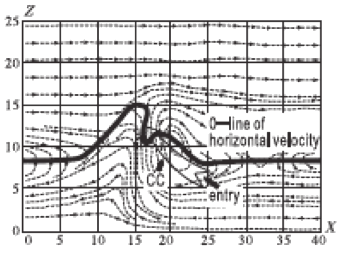
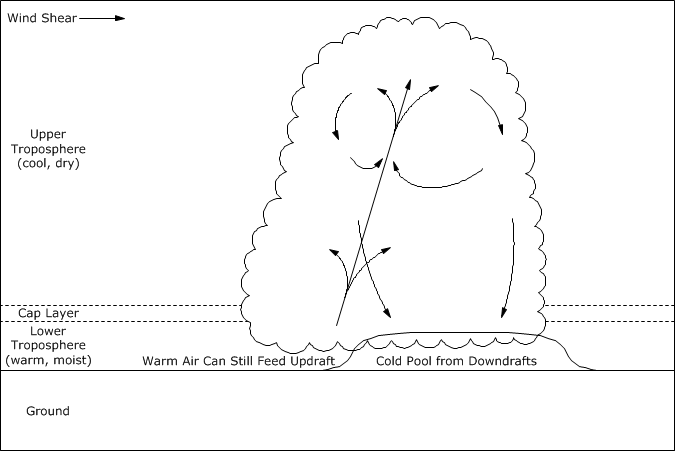
.jpg)
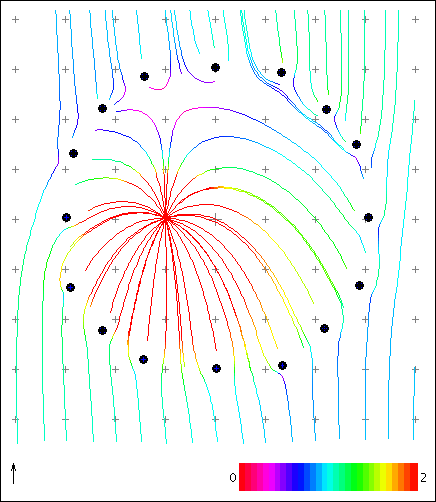
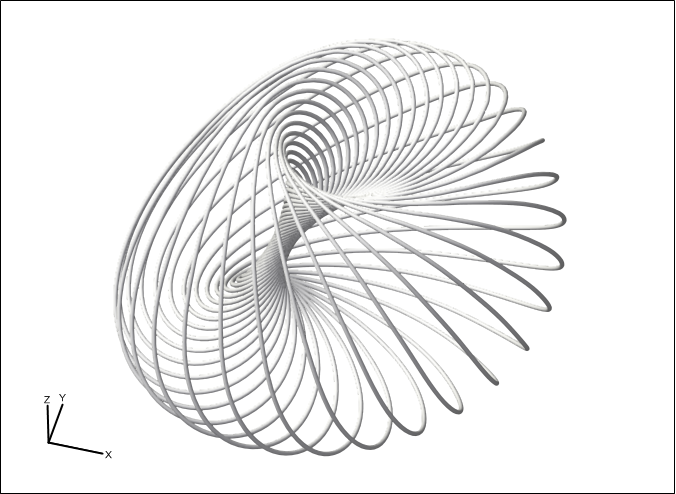
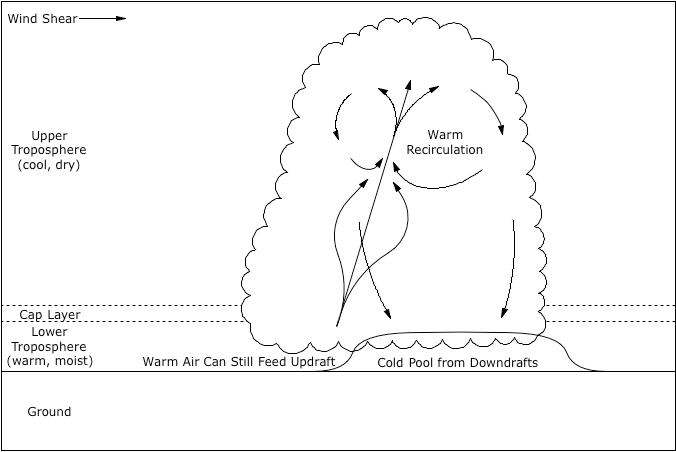
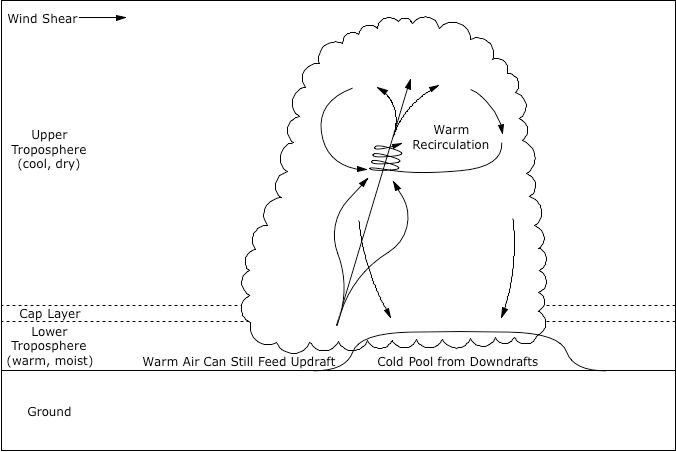
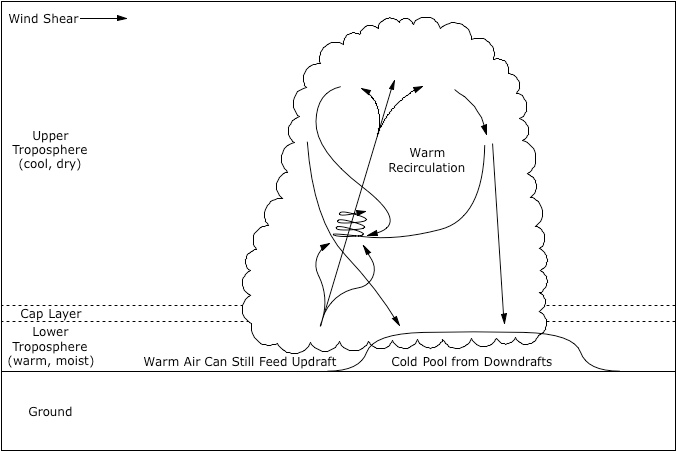
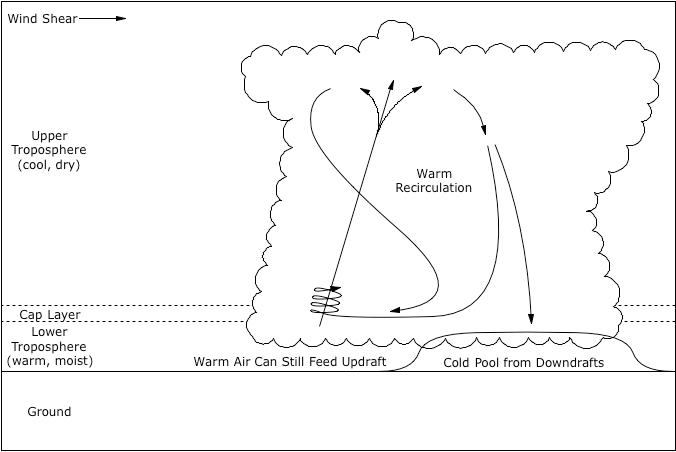
.png)
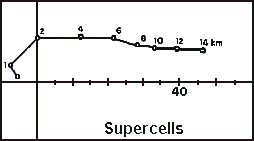
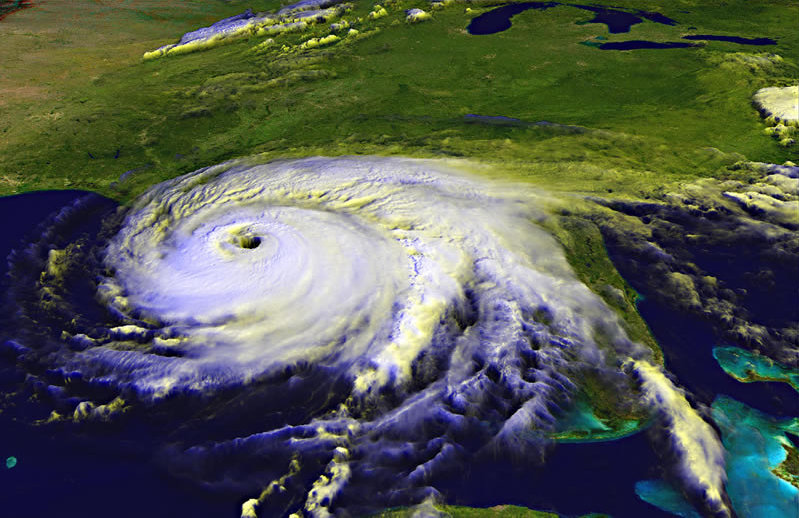
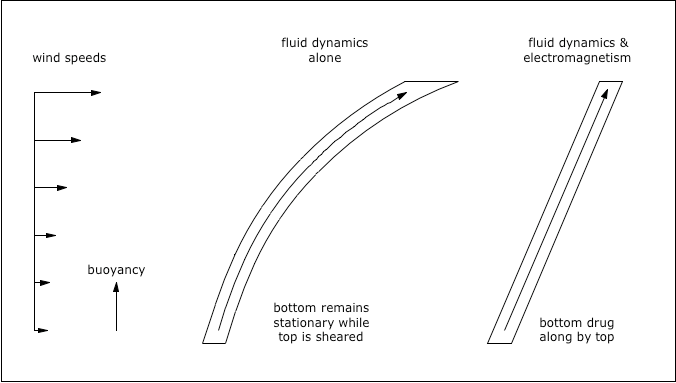
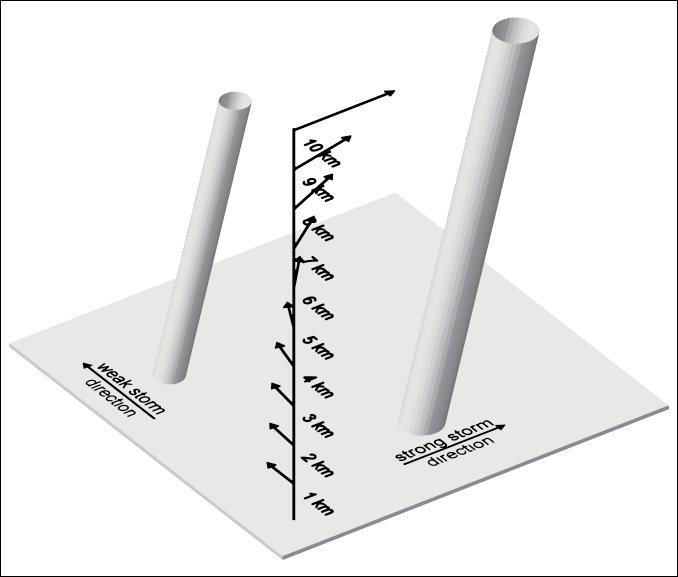
.png)
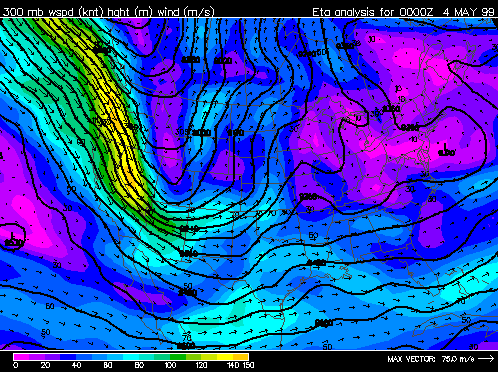
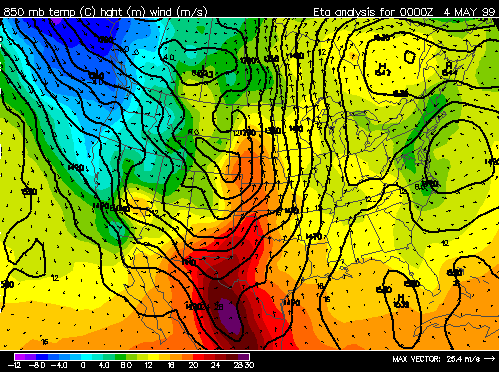
.jpg)
.png)
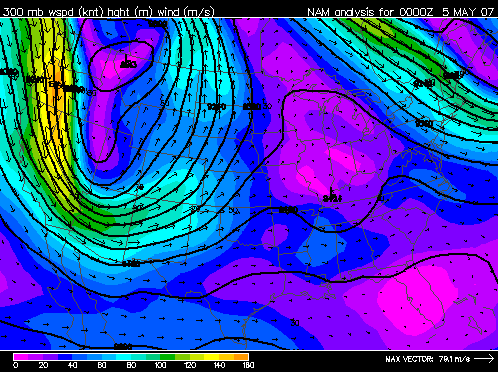
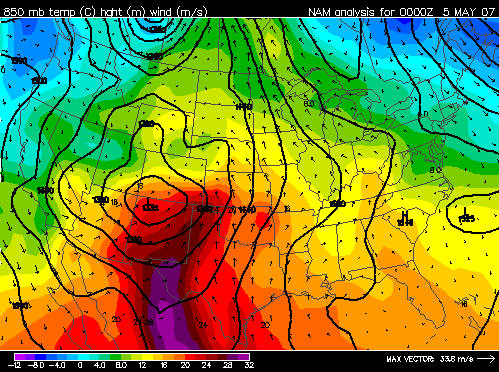
.jpg)
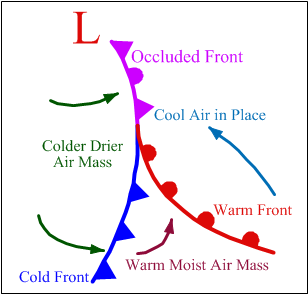
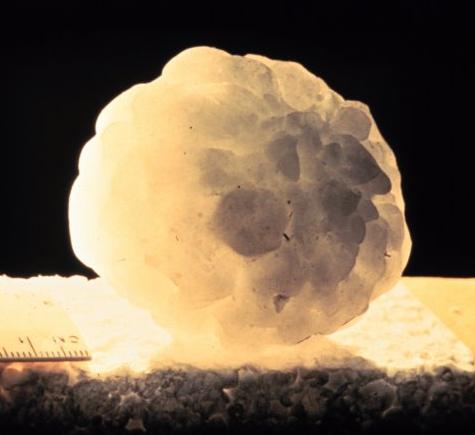
.jpg)
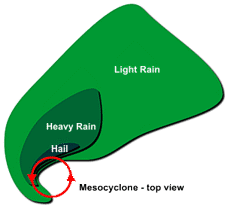
.jpg)
.jpg)
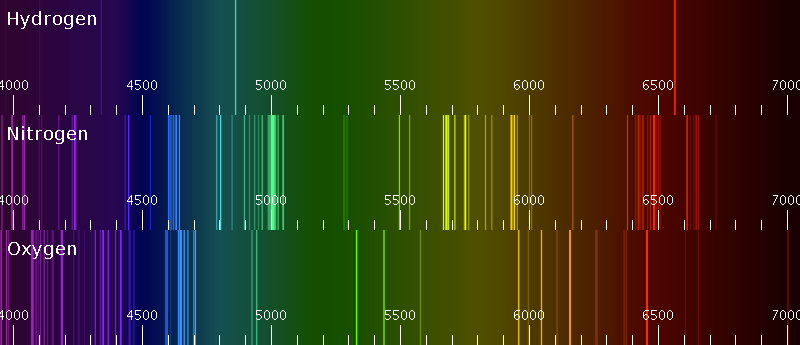
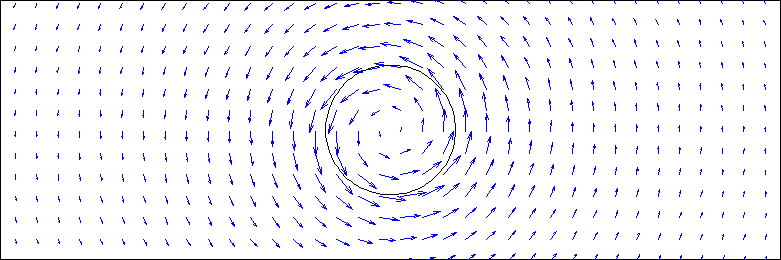
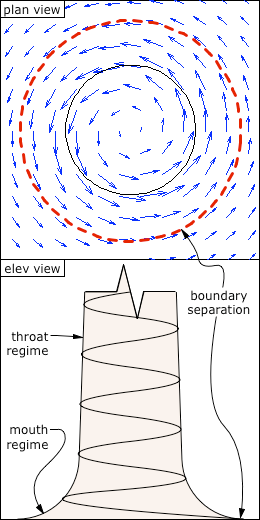
%200.jpg)
%202.jpg)
%205.jpg)
%203.jpg)
%204.jpg)
%207.jpg)
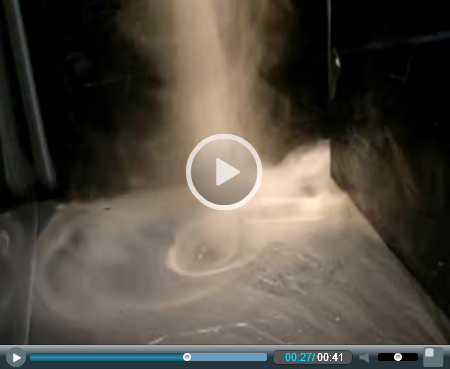
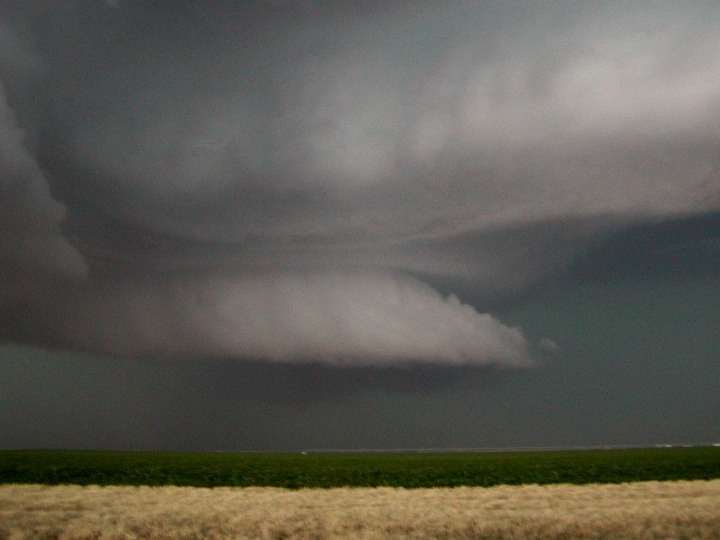
.jpg)
.jpg)
.jpg)
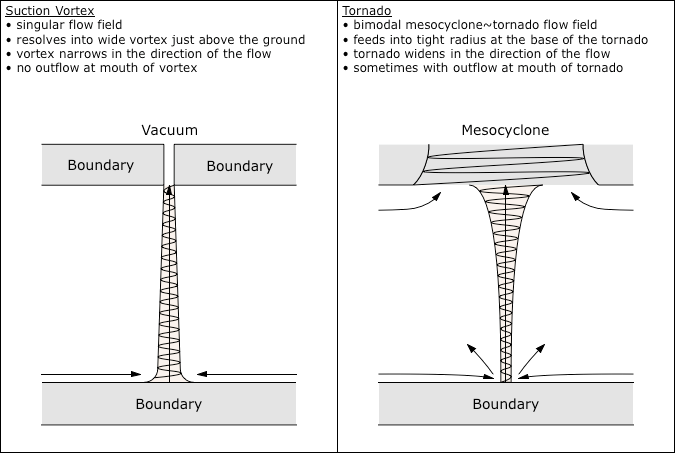
.gif)
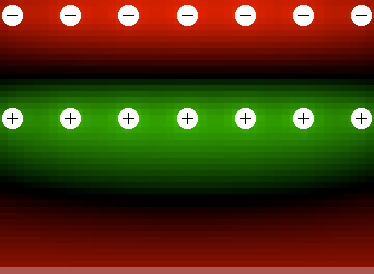
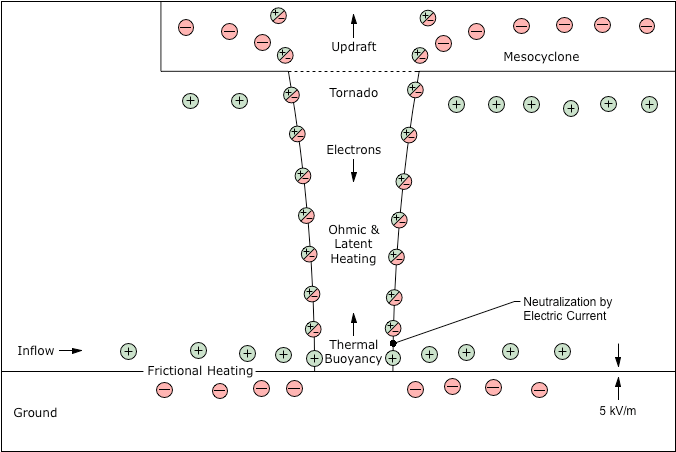

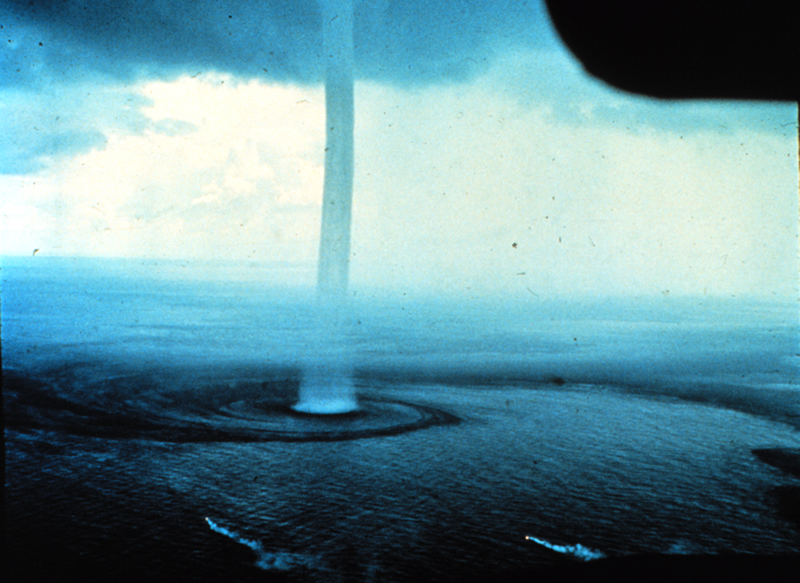
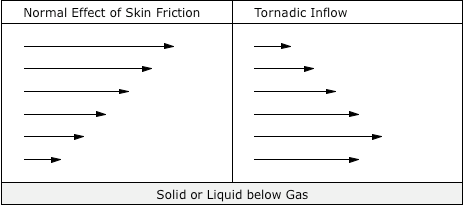
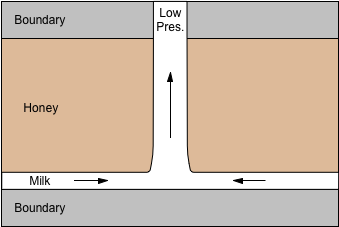
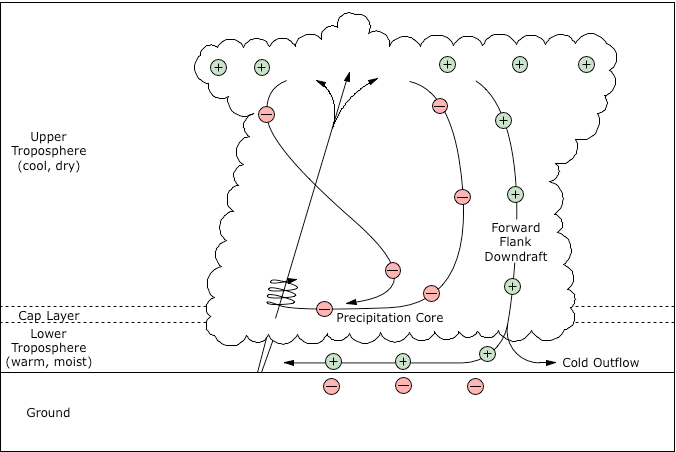
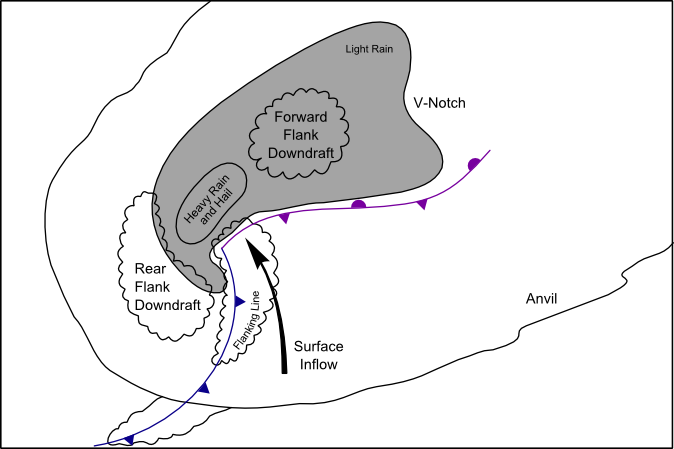
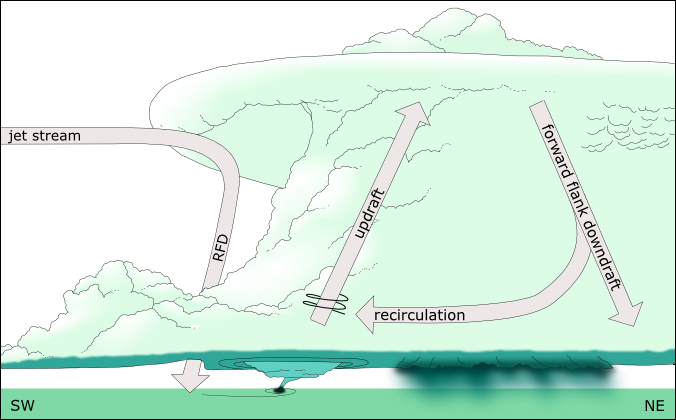
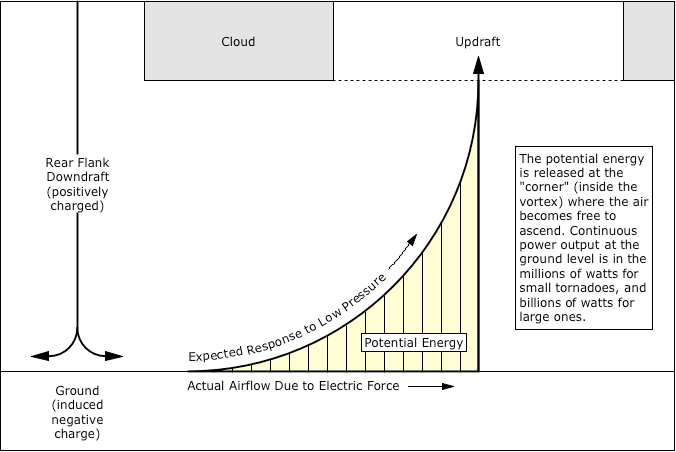
.jpg)
.gif)
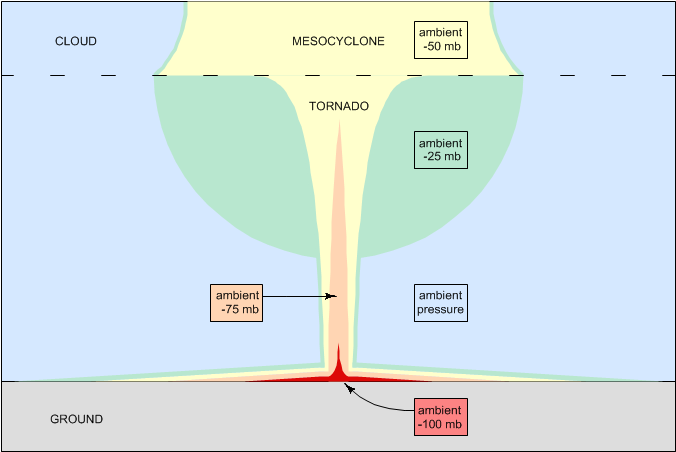
.png)
.jpg)
.jpg)
.png)
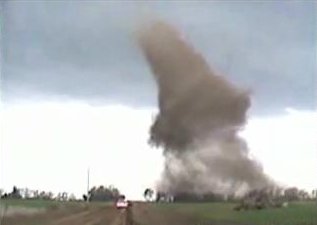
%202.jpg)
.jpg)
.png)
.jpg)
%202.jpg)
.jpg)
.png)


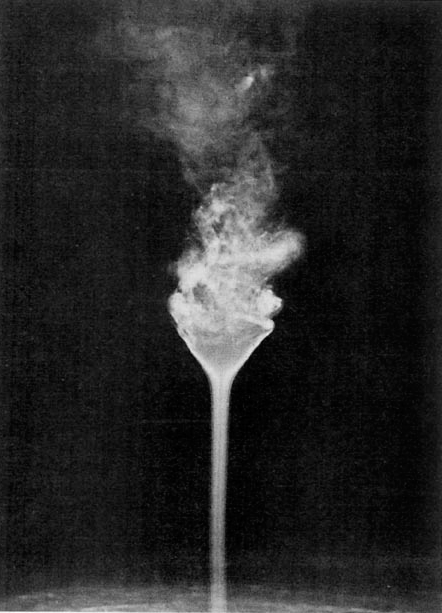
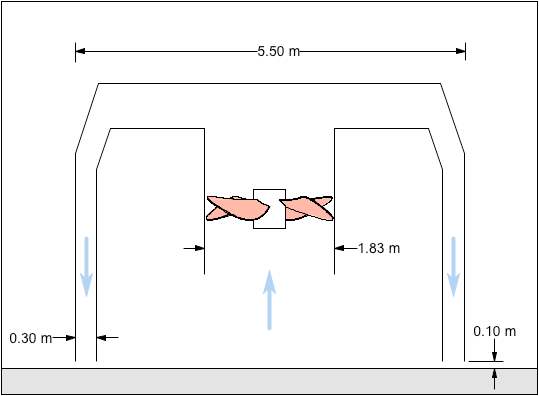
.jpg)
.jpg)
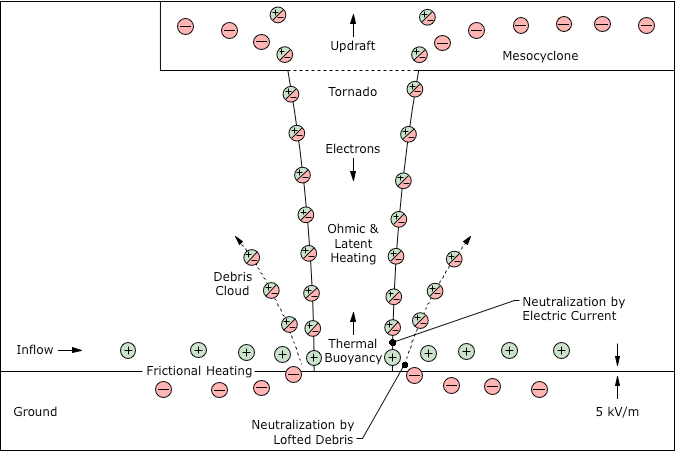
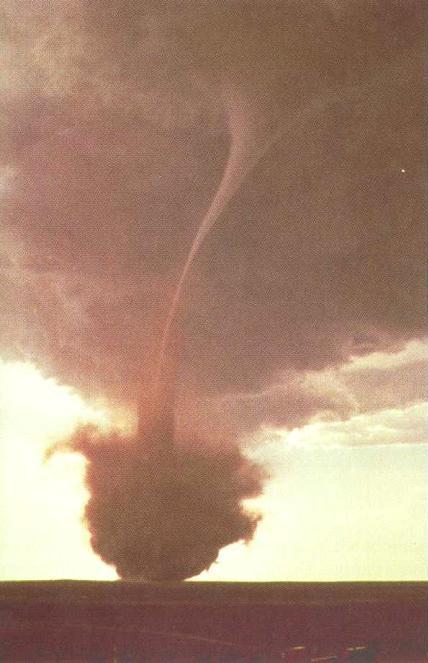
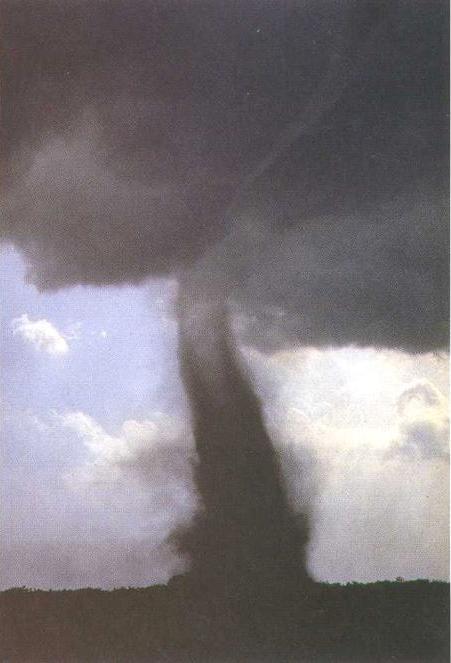
.jpg)
.jpg)
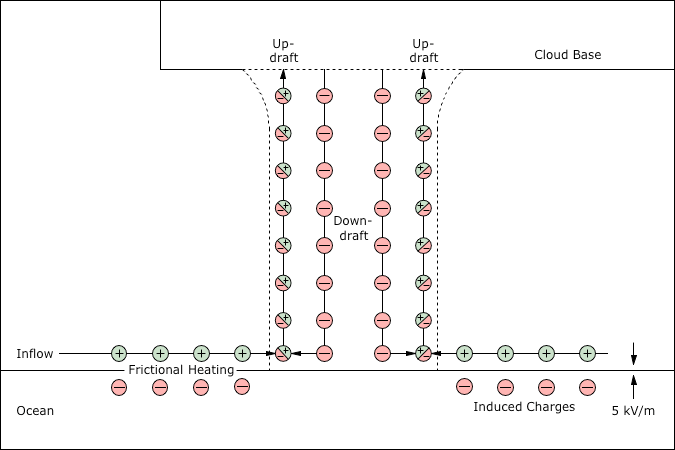
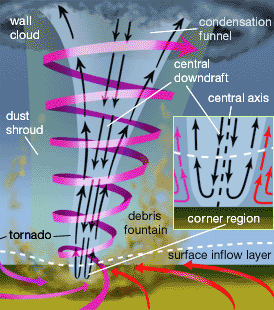
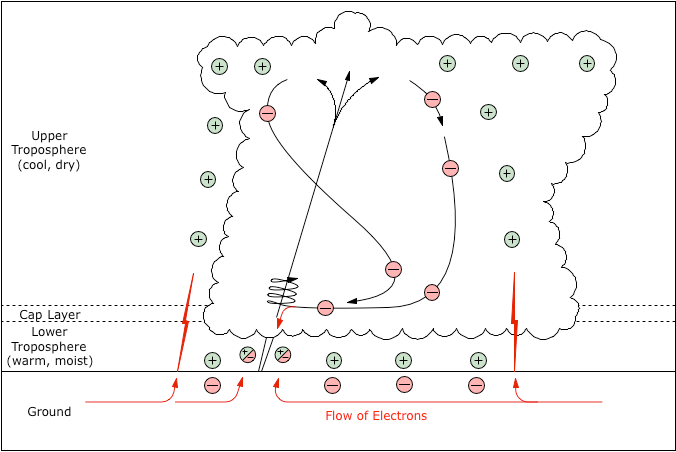
.png)
%201.jpg)
.jpg)
.jpg)
.jpg)
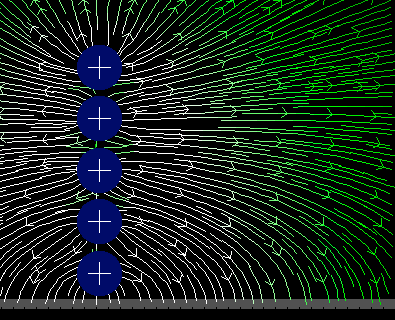
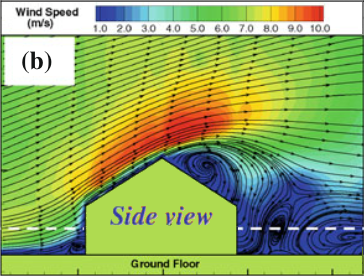
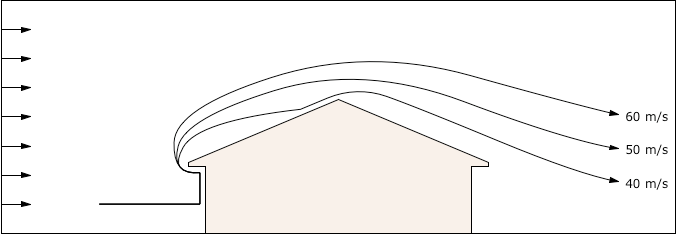
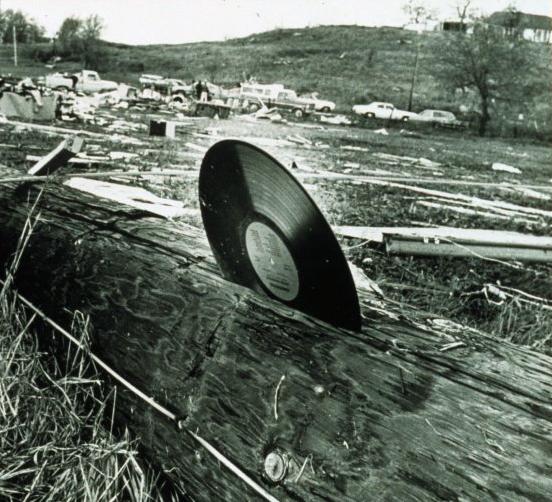
.jpg)
.jpg)
%203.jpg)
.jpg)
.jpg)
.png)
.png)
.png)
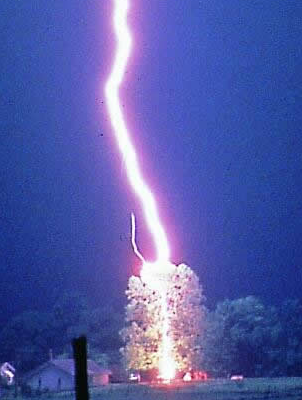
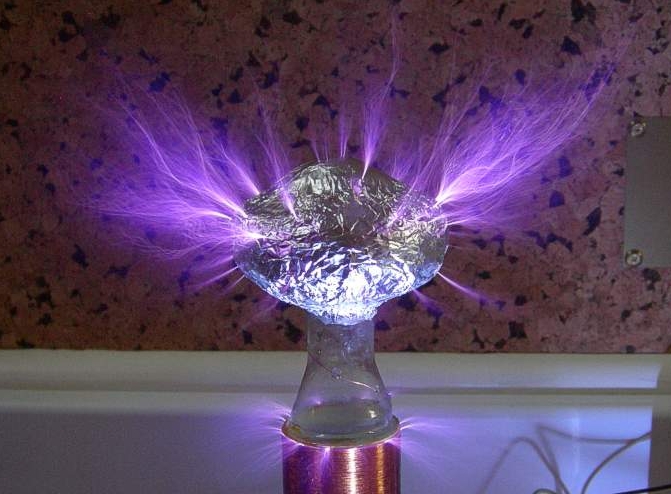
.jpg)
.png)
.png)
.png)
.png)
.png)
.png)
.png)
.png)
.jpg)
.jpg)
.jpg)
.jpg)
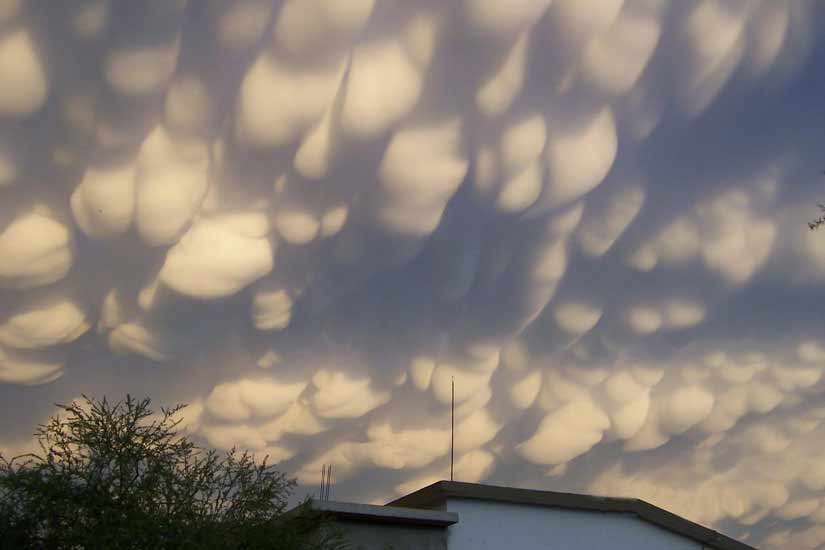
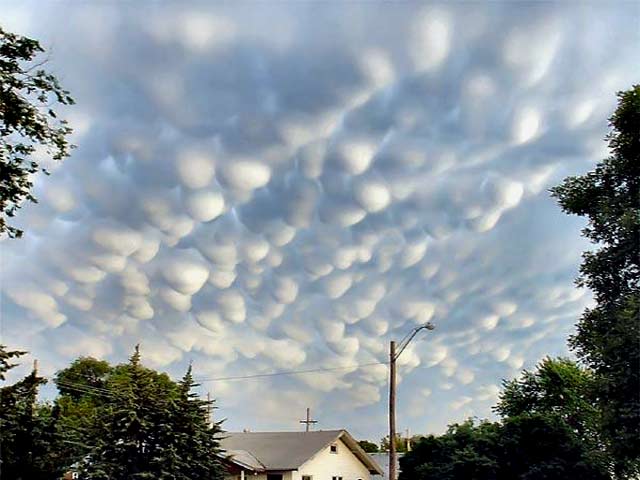
.jpg)
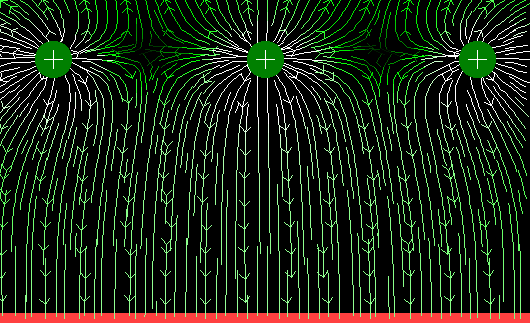
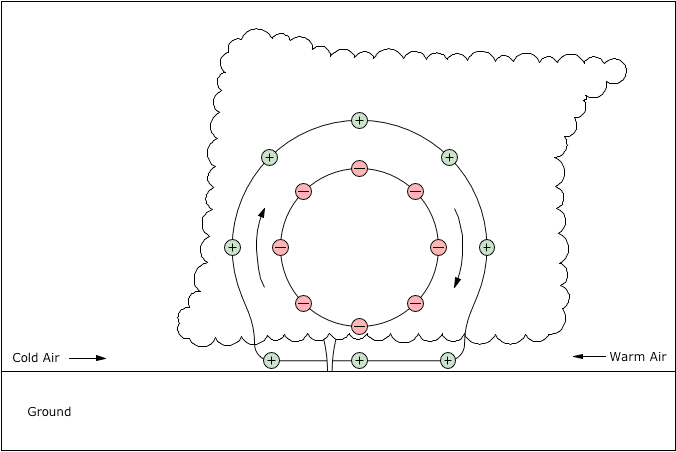
.jpg)
.jpg)
.gif)
%2010.jpg)
%2011.jpg)
%2012.jpg)
%2013.jpg)
.png)
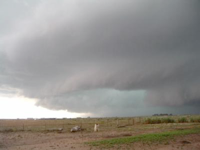
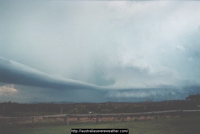
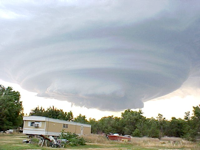
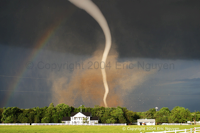
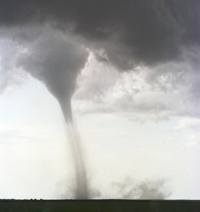
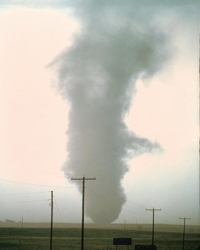
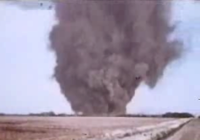
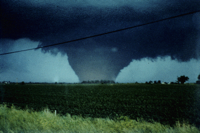
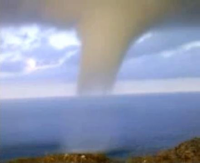
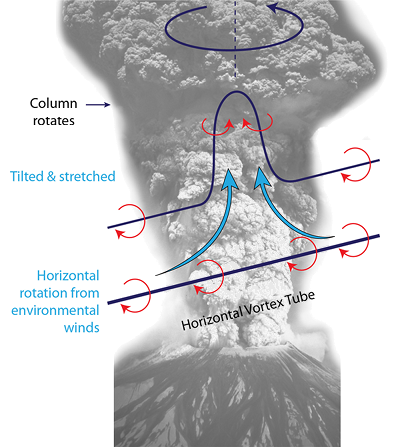
.png)
.jpg)
.jpg)
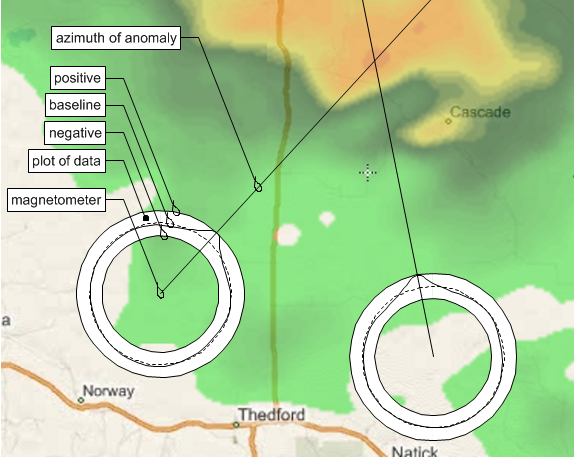
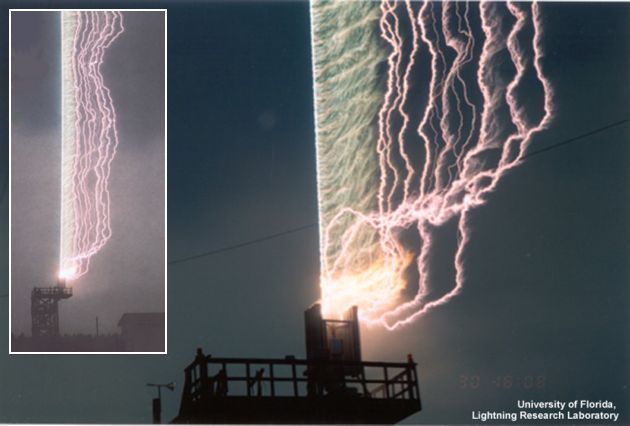
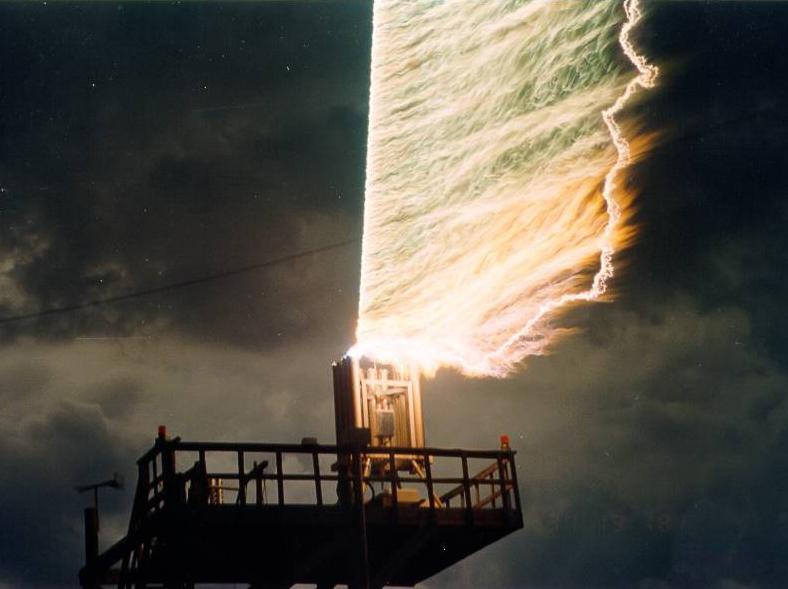
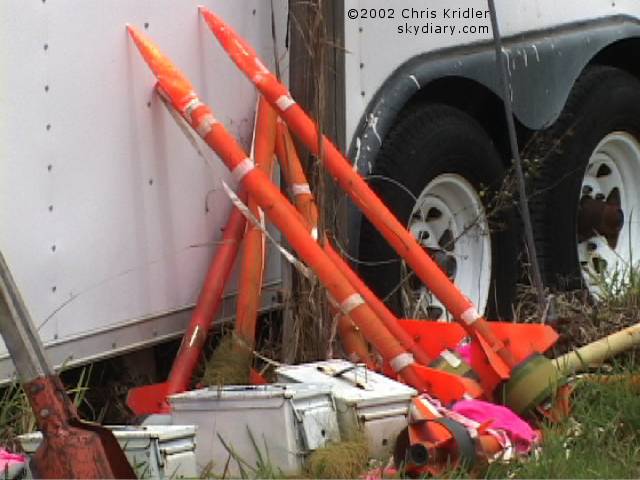
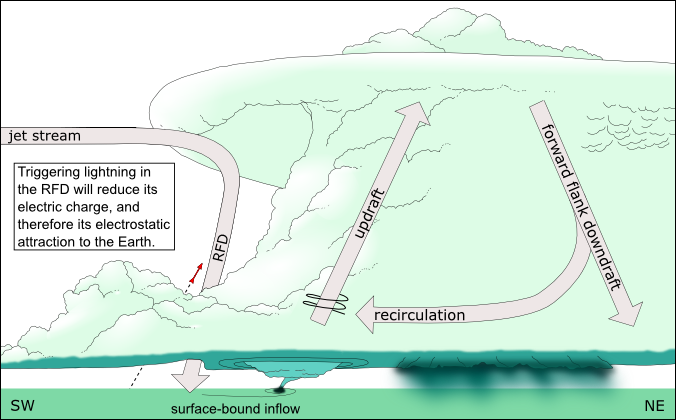
.jpg)
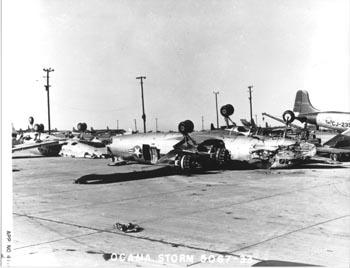
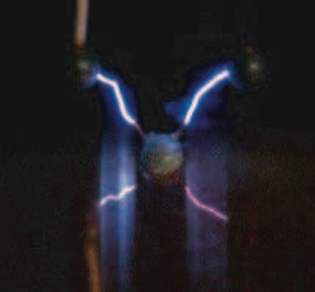

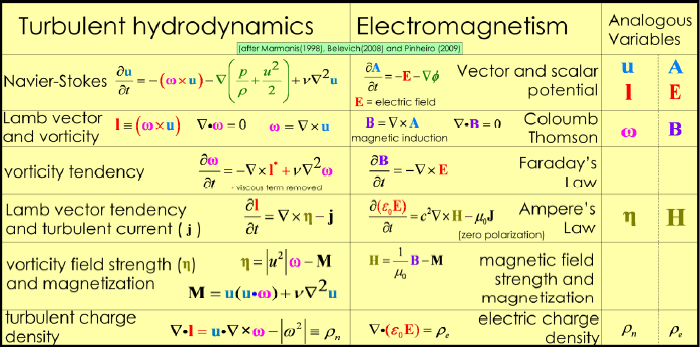
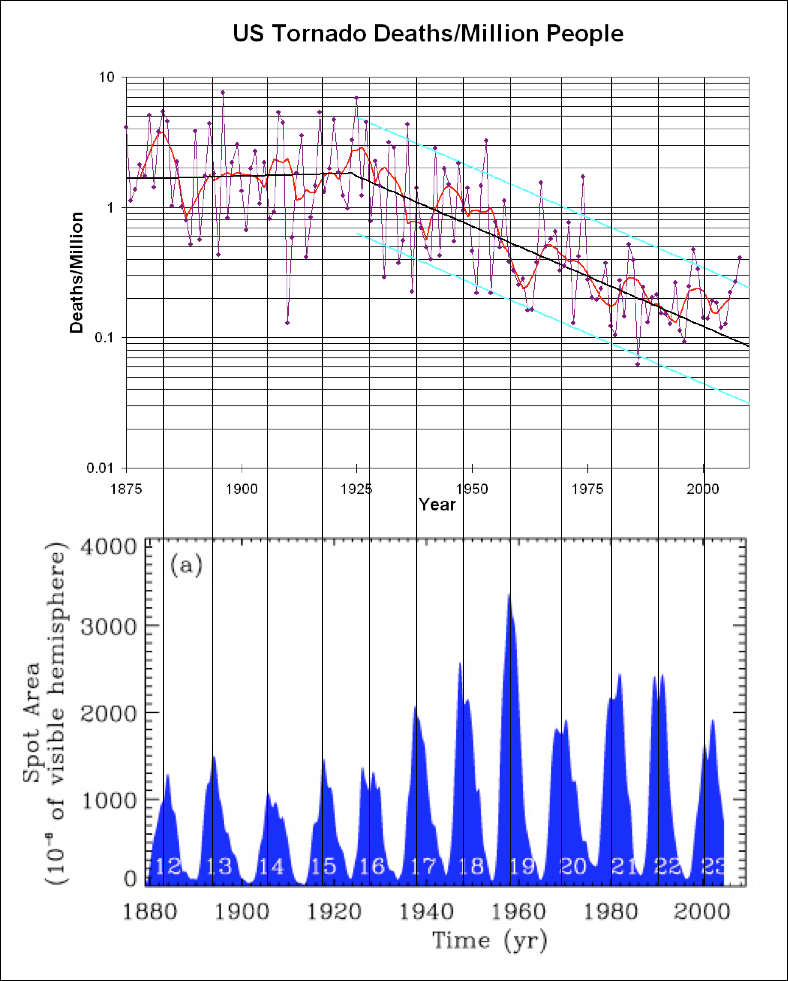
%208.jpg)
%209.png)
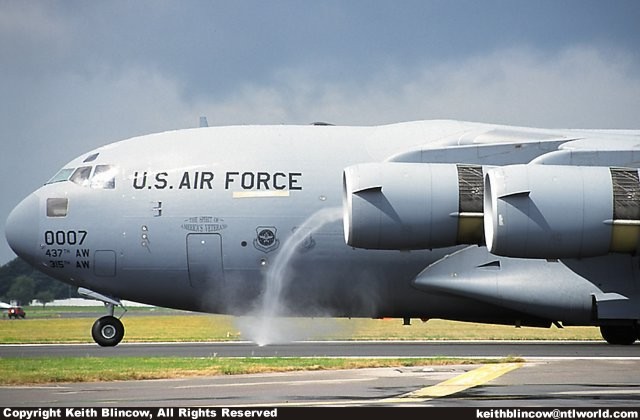
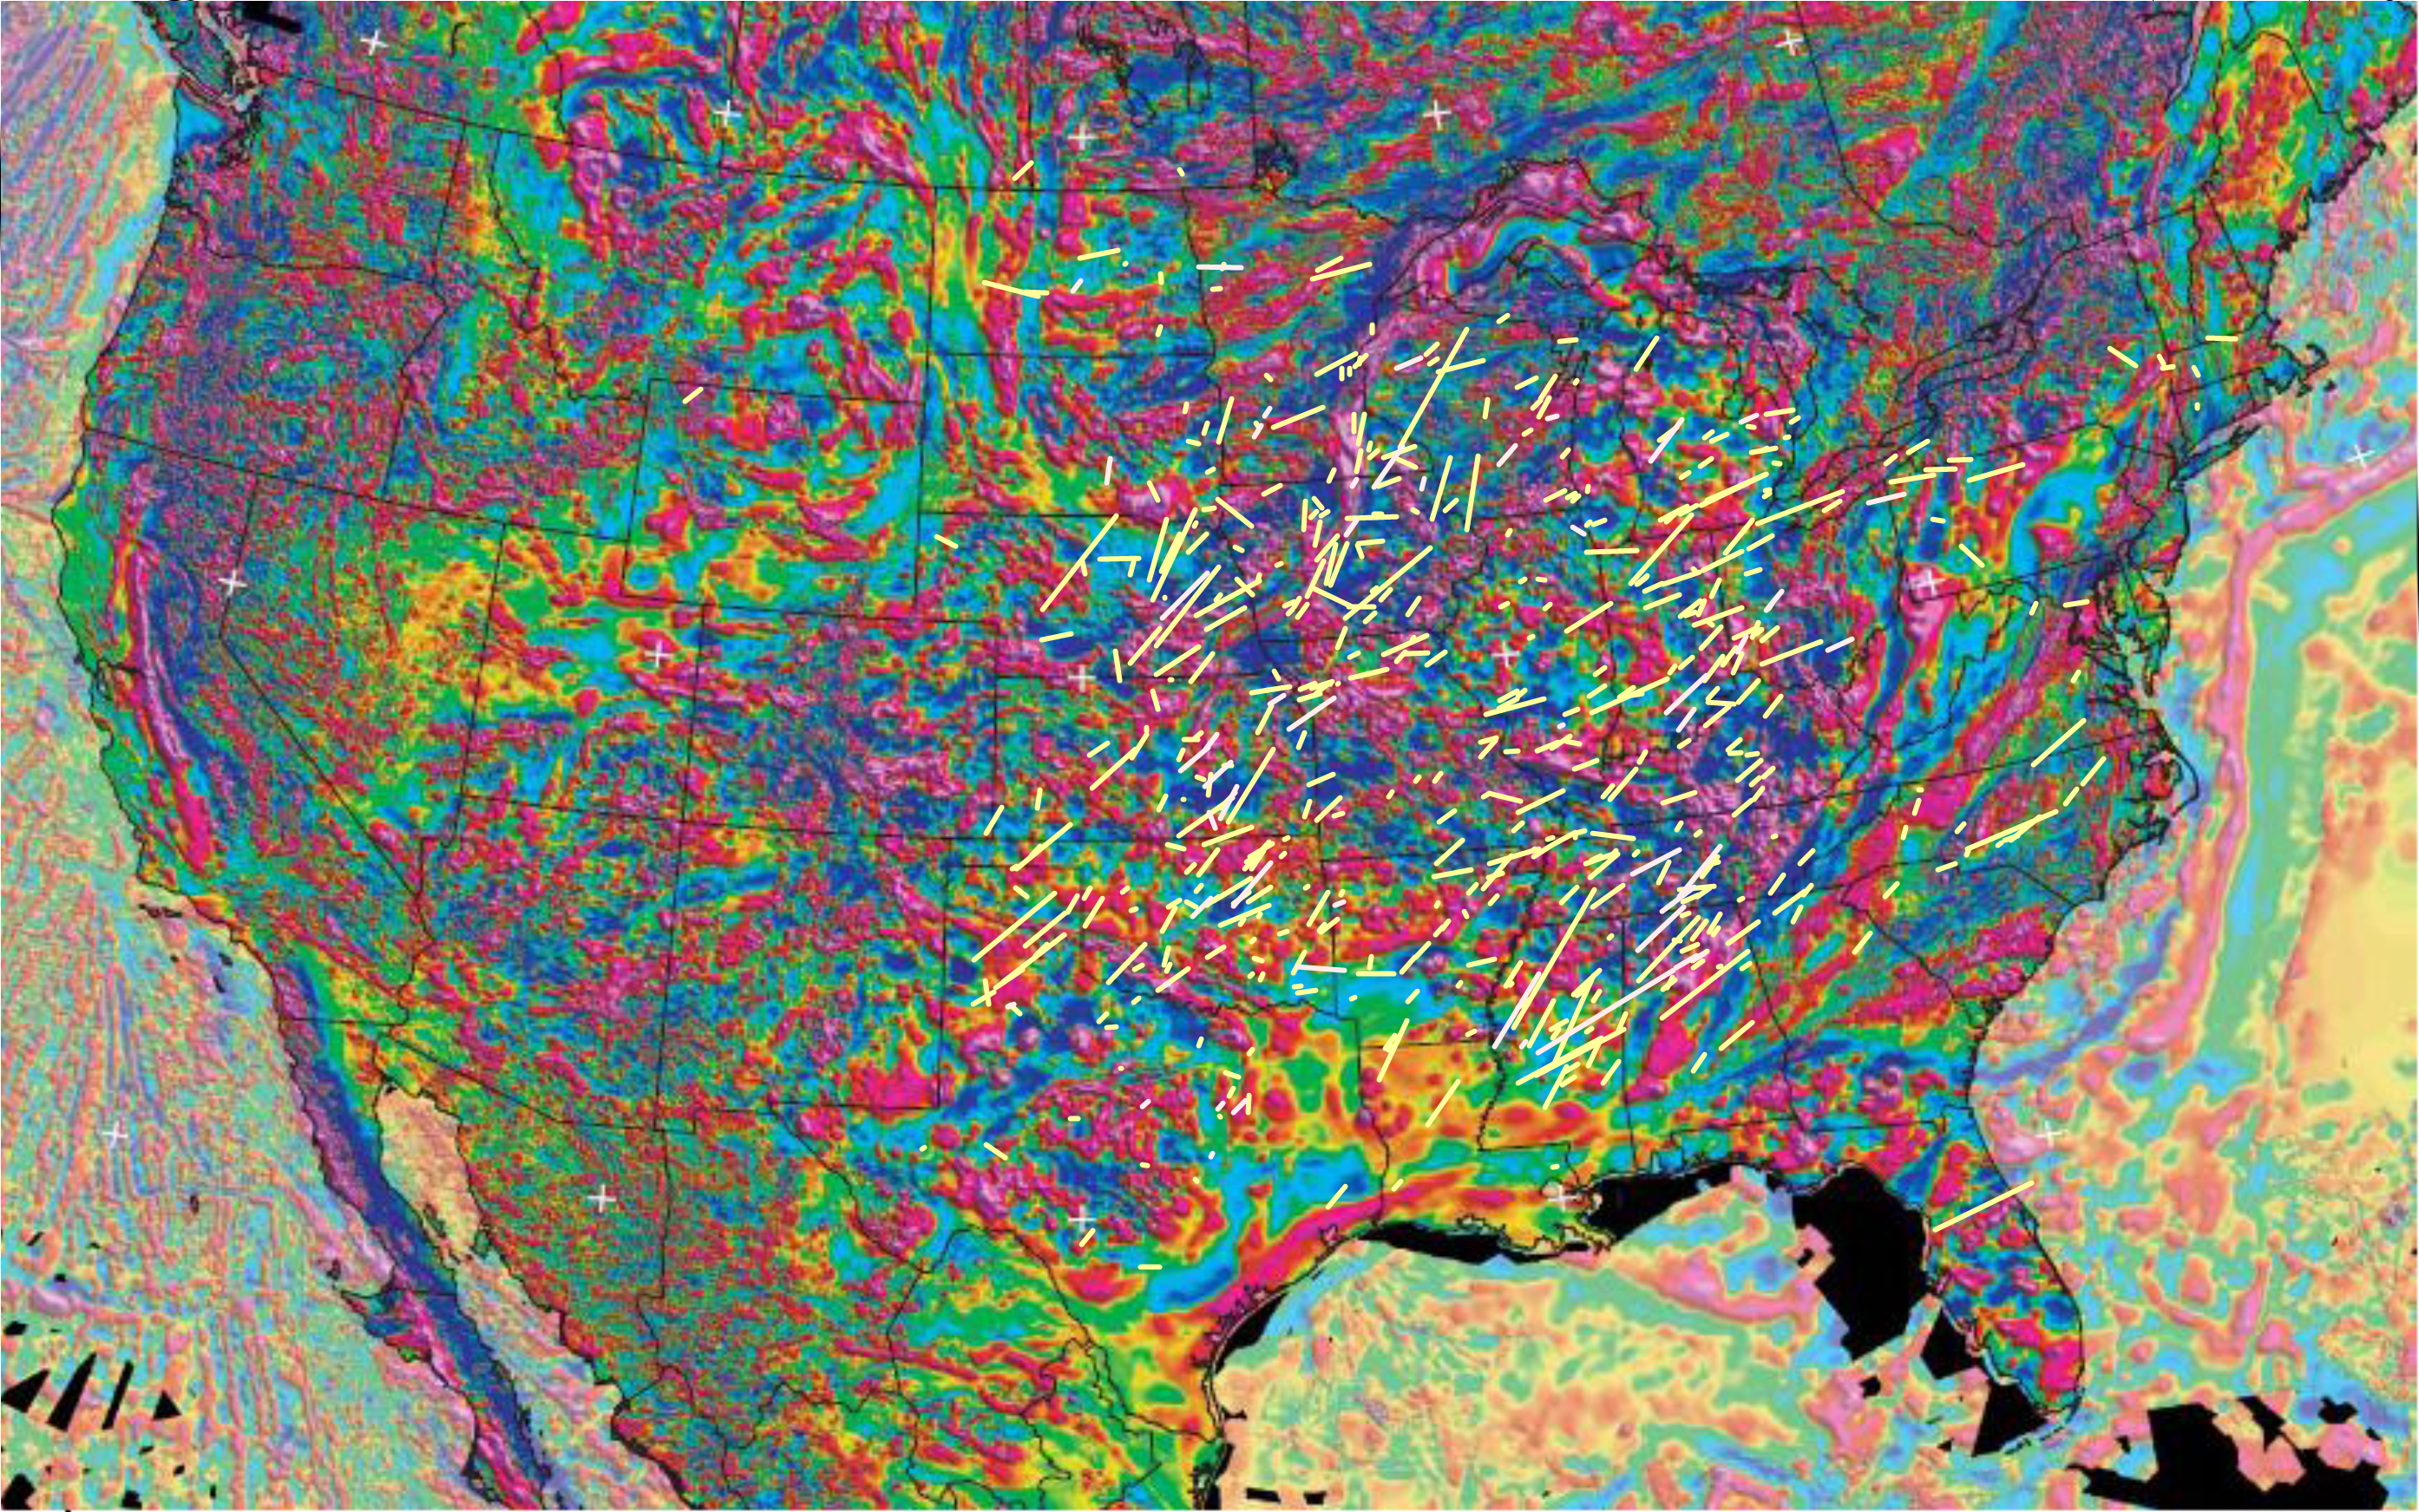